
Gold Price Prediction: Analyst Reveals Why the $4,000 Liquidity Trap Could Trigger a Bigger Crash


Gold is changing hands around $4,049 an ounce. That’s down from Tuesday’s pop, which briefly pushed it past $4,100.
The rally started with softer U.S. inflation data. But the good vibes faded fast. Fed Chair Kevin Warsh poured cold water on things with his cautious take on policy. And the U.S.-Iran situation is still hanging out there unresolved.
So now traders are asking themselves: was Tuesday the start of something real, or just a flash in the pan? One analyst thinks it’s the latter. He says that move was more about hunting for liquidity than a real trend change. And he thinks gold is still in danger of falling back below $4,000, the big psychological number everyone is watching.
What you'll learn 👉
Why the Gold Price Structure Still Favors the Bears
Analsyt Itsadiee_Fx bearish outlook begins with market structure. Gold has been making lower highs since last week. That means every time buyers try to push it up, they fall short of the last peak. The downtrend is still intact.
XAUUSD .
— Itsadiee_Fx (@Itsadiee1) July 15, 2026
🚨 GOLD'S BIGGEST LIQUIDITY TRAP IS HAPPENING RIGHT NOW
After Monday's massive sell-off, we witnessed an almost complete recovery in Gold on Tuesday. There is no doubt that the market completely ignored classic price action. Monday's selling volume was extremely… https://t.co/KL1212kXxo pic.twitter.com/8UHyDbuKe0
Monday’s selloff drove that point home. Heavy selling knocked bullion below $4,000. Then Tuesday’s inflation numbers came out and sparked a quick bounce. But that bounce didn’t change the bigger picture, none of those lower highs got broken.
For that analyst, the overall trend matters more than one rally driven by a single news event. Until buyers can take out those previous highs, sellers are still running the show on the larger timeframe.
How the $4,000 Gold Liquidity Trap Is Unfolding
The analyst thinks this week’s moves were all about hunting for liquidity. Monday’s drop wiped out the long positions that had piled up below $4,000, the level where a lot of traders had their stop-loss orders parked.
Once everyone was leaning bearish, Tuesday’s soft inflation data set off a fast rally that caught new short sellers off guard. That reversal pulled a bunch of traders back in above $4,000. And now those fresh long positions are just more fuel, another pool of liquidity for the market to go after on the next leg down.
The result is a market driven more by positioning than clean technical behavior. Instead of confirming a bullish reversal, the analyst sees another opportunity for larger players to attract buyers before pushing prices lower.
Why the Analyst Still Expects the Gold Price to Fall
Tuesday’s bounce didn’t change the analyst’s bearish view. Buyers couldn’t hold the 61.8% Fibonacci level near $4,058. Sellers jumped back in fast and wiped out nearly half of the CPI rally in just one day.
That breakdown puts the spotlight on $4,011, the level the analyst calls the most important floor right now. If the gold price closes below that, $4,000 gets tested. And once that breaks, stop-losses start popping off, likely pulling prices down even further.
Until gold can clearly break above those recent lower highs, the analyst says the smart move is to sell into rallies, not chase them.
Gold Price Analysis: Key Levels to Watch
We had a look at the chart, and it aligns closely with the analyst’s outlook. Price has been rejected several times from the resistance zone between $4,060 and $4,100, shown by the highlighted supply areas on the chart. Those repeated failures have preserved the pattern of lower highs.
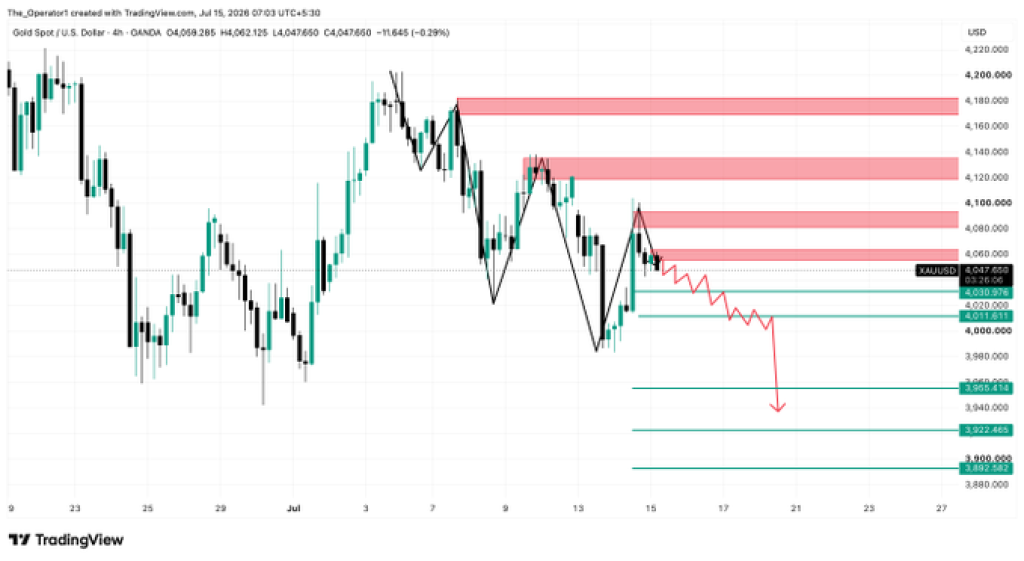
The nearest support comes in around $4,020, followed by the critical $4,011 level. A break below that zone exposes $3,956, with additional downside targets around $3,922 and $3,892, all marked as the next demand areas.
If buyers regain control, the first resistance remains $4,060, followed by $4,100, $4,140, and $4,180. Clearing those zones would invalidate the immediate bearish setup and put the gold price back on a stronger footing.
Related Gold News: Gold and Silver Price Forecast: Popular Analyst Says Buy the Panic at $3,600 and $50
Gold Price Prediction: Will XAU/USD Crash Below $4,000?
Here’s the bullish take: gold gets back above $4,060 and pushes through $4,100, buyers might have enough steam to run it up to $4,140.
Here’s the bearish take: $4,011 is the line in the sand. Lose that for good, and gold drops below $4,000. Then $3,956 comes into view. If selling picks up, $3,922 isn’t far off.
The most probable path? The gold price chops around between $4,060 on the top and $4,011 on the bottom until one side finally wins and breaks out.
Frequently Asked Questions
Subscribe to our YouTube channel for daily crypto updates, market insights, and expert analysis.






