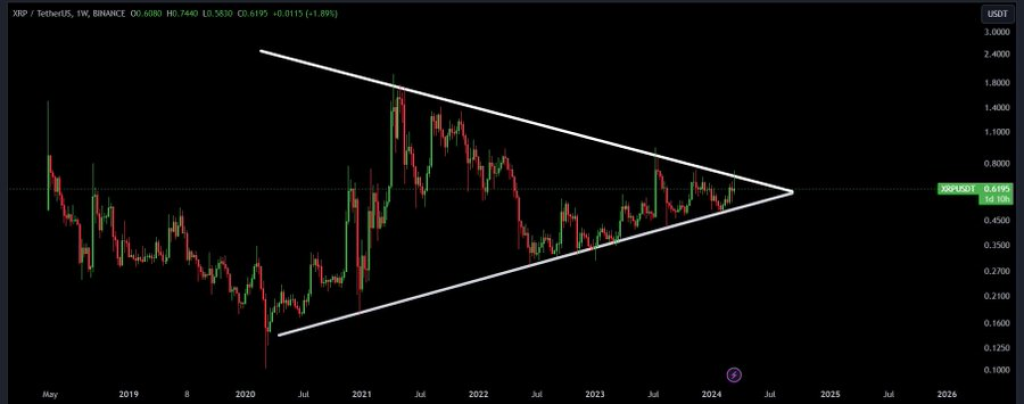
Technical analysts and experts weigh in on the potential trajectory of Ripple’s XRP. Among them is a prominent figure known as Ash Crypto, with 1 million followers on X who has shed light on a significant pattern forming on XRP’s weekly chart – a big symmetrical triangle that has been in play since 2020.
According to Ash Crypto’s analysis, XRP has been trading within the confines of this symmetrical triangle, a pattern that is typically characterized by two converging trendlines, one representing resistance and the other support. As the trendlines converge, the expectation is that the price will eventually break out, either upwards or downwards, signaling a potential for a major move.

Ash Crypto’s assessment is further corroborated by additional analysis, which suggests that the price of XRP has been consistently bouncing off the lower channel line, acting as a solid support. Meanwhile, the base line has formed a mini ascending channel, providing an additional layer of support for the price.
Doge2014 raises 500K in days celebrating Dogecoin. Make potentially big profits and get in on exclusive airdrop!
Show more +Notably, the analysis indicates that the base and upper lines of the symmetrical triangle are now becoming increasingly thin and close, heightening the anticipation of an imminent breakout. A successful breakout from this pattern could potentially trigger a significant price spike for XRP.
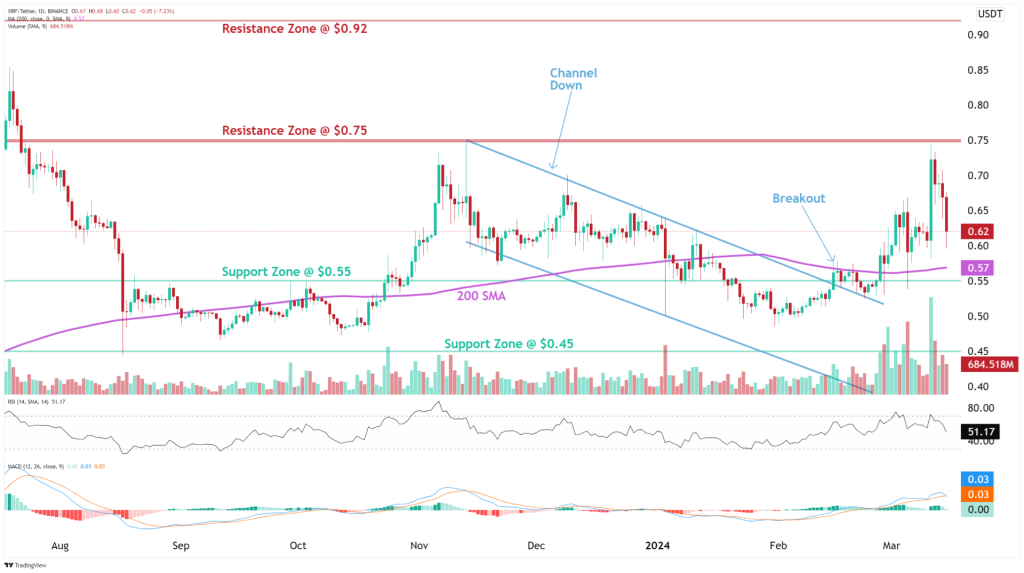
Complementing these technical observations, the crypto analytics company altFINS has also weighed in with its analysis, providing insights into the support and resistance zones to watch out for.

altFINS’ trade setup suggests that XRP is currently in an uptrend, having previously broken out from a Channel Down pattern, signaling a bullish trend reversal. The analysis recommends waiting for a pullback near the $0.57 support area, which coincides with the 200-day moving average, as an attractive swing entry point in the uptrend. If this entry is captured, altFINS projects a potential upside of around 25% back to the $0.75 resistance level and, if breached, potentially even reaching $0.92 thereafter. The suggested stop-loss level is set at $0.47.
Regarding momentum indicators, altFINS notes mixed signals, with the MACD line above the MACD signal line, indicating bullish momentum, but the Relative Strength Index (RSI) hovering around 50, suggesting a neutral stance. Additionally, the declining MACD histogram bars suggest that momentum may be weakening.
You may also be interested in:
- Grayscale Prepares for a Bitcoin Sell-Off, But Should This Worry Us?
- Ripple’s XRP Could Soon Soar to $1 According to This Analyst’s Charts
- Worldwide Crypto Magnetism Intensifies as Avalanche (AVAX) & Tether (USDT) Adopt Raffle Coin (RAFF) Presale for Anticipated 100X Upswing
We recommend eToro
Wide range of assets: cryptocurrencies alongside other investment products such as stocks and ETFs.
Copy trading: allows users to copy the trades of leading traders, for free.
User-friendly: eToro’s web-based platform and mobile app are user-friendly and easy to navigate.


