
Stellar (XLM) is approaching a pivotal technical zone that could determine its next move, according to crypto expert Ali. In a tweet, the analyst highlighted a trendline that has served as consistent support for Stellar’s price action since mid-March. The trendline, currently under pressure, has already been tested multiple times and is seen as a key level for potential bullish continuation.
Ali’s tweet, which reads “This trendline has supported #Stellar $XLM since mid-March. If it holds, a rebound could follow,” underscores the relevance of the ongoing price action. With XLM now trading just above the ascending trendline, market participants are monitoring price behavior closely.
What you'll learn 👉
XLM Trendline Maintains Upward Momentum Since Mid-March
The 4H chart for XLM shows that Stellar’s price began forming an ascending structure around March 11, when its price was trading below $0.245. Since then, the market has established a clear pattern of higher highs and higher lows, supported by a gradually rising trendline.
This trendline has held through at least four separate retests; on March 13, 16, 21, and again on March 27. During this period, XLM price movement has reflected sustained buying interest, with temporary consolidations followed by upward moves.
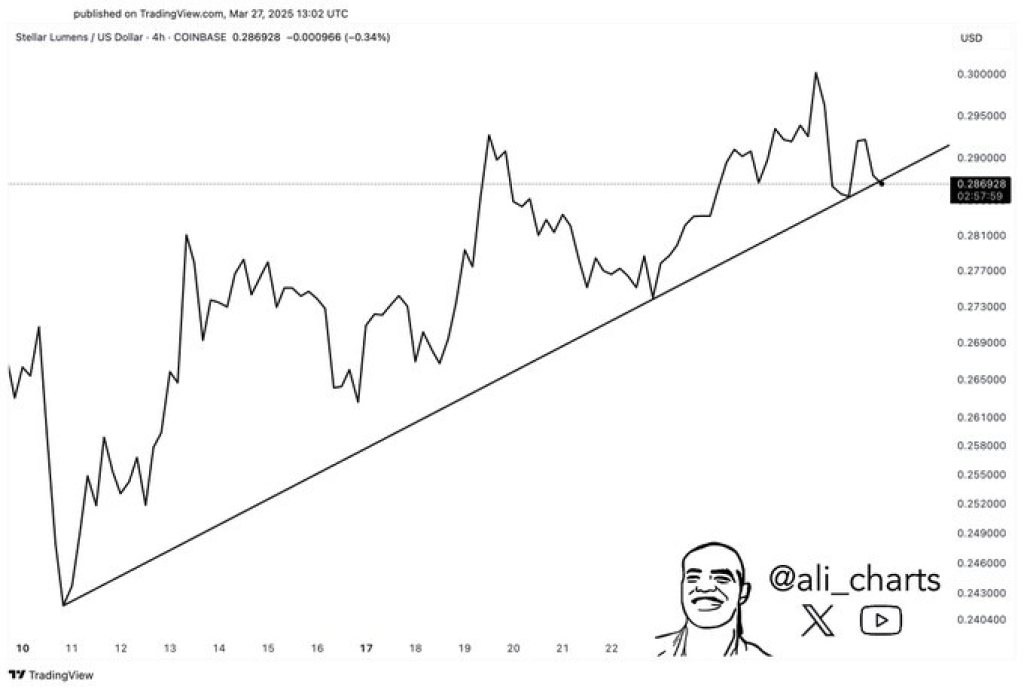
Stellar Current Market Structure Faces a Key Test
As of the latest data, XLM price is trading at approximately $0.2869, hovering just above the trendline. The chart reveals a tightening range, with the price testing support between $0.2810 and $0.2825. This zone has functioned as short-term support, with lower levels at $0.2700–$0.2730 acting as a backup zone based on historical reactions.
There were two strong breakout moves on March 17 and March 25, showing some solid momentum behind XLM. But even with that push, the price kept getting rejected around the $0.295 to $0.300 zone — that area’s been acting as tough resistance.
Read Also: Time to Buy PEPE? Meme Coin Whale Says Yes, But This $0.0016 Rival Is a Better Altcoin Pick
Outlook Hinges on XLM Price Reaction to Current Support Zone
Market conditions suggest that a rebound could follow if buyers defend the trendline successfully. If the current support holds, XLM price could make another run toward that $0.295–$0.300 range. On the flip side, if it slips below the trendline, the price might drop back toward $0.273 or even lower.
The chart didn’t show volume, so we’re missing a key piece of the puzzle. Watching volume could help confirm whether any bounce or breakdown has real strength behind it. For now, it’s all about how the price behaves around this support area — that’s what traders are keeping an eye on.
Subscribe to our YouTube channel for daily crypto updates, market insights, and expert analysis.

We recommend eToro
Wide range of assets: cryptocurrencies alongside other investment products such as stocks and ETFs.
Copy trading: allows users to copy the trades of leading traders, for free.
User-friendly: eToro’s web-based platform and mobile app are user-friendly and easy to navigate.