XRP recent price activity has attracted market attention as a potential short-term reversal appears to be forming. On X, crypto expert Ali pointed to a key technical indicator that may suggest a rebound is in progress.
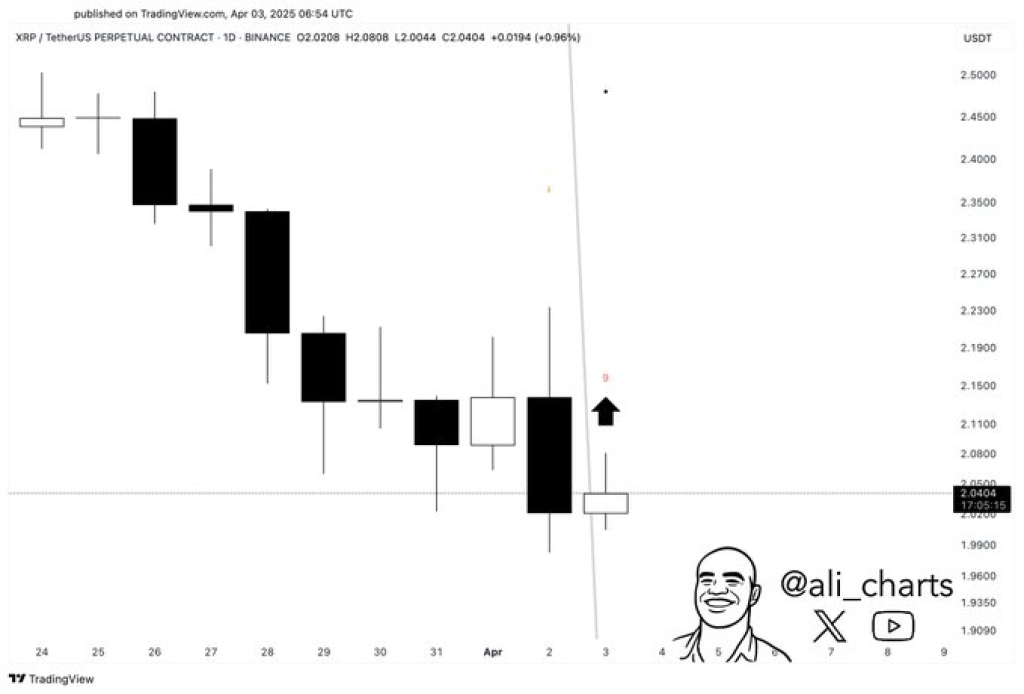
He wrote, “$XRP could be setting up for a rebound! Holding above $2 while the TD Sequential flashes a buy signal!” This observation aligns with visible chart patterns that hint at a change in direction. With the price of XRP maintaining support at $2, traders are monitoring this development.
What you'll learn 👉
Technical Analysis of XRP Price Action
XRP has remained in a downward trend from March 24 through April 2, marked by multiple consecutive bearish candles. On April 1, the market formed a strong bearish candle with a long lower wick, signaling price rejection at lower levels. The following session on April 2 produced a doji-style candle, indicating indecision among market participants.
By April 3, the formation of a bullish candle brought fresh attention to the chart. The price of XRP held above the $2.00 level, a psychological support zone tested twice in recent days. This consistent defense suggests an area where buyers are showing interest, creating a foundation for a possible recovery.
One of the focal points in Ali’s tweet is the TD Sequential indicator. Seeing a “9” pop up on the chart? That usually hints we might be nearing a reversal. It’s a signal a lot of technical traders look for, suggesting that the current trend could be losing steam or taking a breather.

A few other things are backing this up too, like a vertical dashed trendline and an upward arrow, both pointing to a possible shift in momentum. These visual cues are interpreted by many as preparation for upward movement, provided XRP price action confirms the setup in the following sessions.
Read Also: Pi Coin Price Prediction for Today (April 3)
XRP Key Price Levels and Future Outlook
Now, the $2.00 level is still a key support zone to watch. If XRP price manages to close above the $2.08–$2.10 range on the daily chart, that could be the green light for a move higher.
In that case, the next resistance levels to keep an eye on are $2.20, $2.35, and $2.50. These aren’t just random numbers; they line up with where prices reacted in the past, so they could be important checkpoints if the rally continues.
On the flip side, if the price of XRP can’t stay above $2.00, this whole setup could fall apart. A drop below that might open the door to more downside, with the next support zones around $1.90 and $1.80.
XRP Market Sentiment and Strategy
Following several days of downward pressure, XRP price may be entering an oversold zone, prompting some traders to consider entries based on reversal signals. So while the chart is showing signs of a possible bounce, traders will likely wait for a bit more confirmation—specifically, a strong move above near-term resistance.
At the moment, XRP is hovering near that $2.00 support zone. The next few trading sessions could be crucial in deciding whether we’re looking at the start of a bigger rebound or just a short pause before the trend continues.
Subscribe to our YouTube channel for daily crypto updates, market insights, and expert analysis.
We recommend eToro
Wide range of assets: cryptocurrencies alongside other investment products such as stocks and ETFs.
Copy trading: allows users to copy the trades of leading traders, for free.
User-friendly: eToro’s web-based platform and mobile app are user-friendly and easy to navigate.


