
Ethereum continues to struggle with a downtrend following its weakened performance after the breakout above the level of $2,500 previously seen in 2026. The ETH price has fallen below the $2,088 mark, which is the level of the 100-period Simple Moving Average.
We had a look at the ETH chart, and the structure is still leaning bearish. The market keeps printing lower highs and lower lows, and the bounce from the mid-May drop hasn’t shown much follow-through. Even when price tries to recover, sellers step in near resistance and cap the move.
What you'll learn 👉
Key Levels and What the ETH Chart Is Showing
The 100 SMA at $2,088 is the main level to watch on the upside. Every retest of this zone has led to rejection, which shows that buyers haven’t been able to take back control yet. Under current prices, ETH is trading near the range of $1,967-$1,990, which currently serves as support.
The RSI stands at 39.28, approaching overbought territory but still far from reaching it. This generally suggests that bearish momentum has slowed but is by no means a guarantee of a bullish reversal. Previous instances of bearish divergence have been observed where prices attempted to rise but lacked the same momentum.
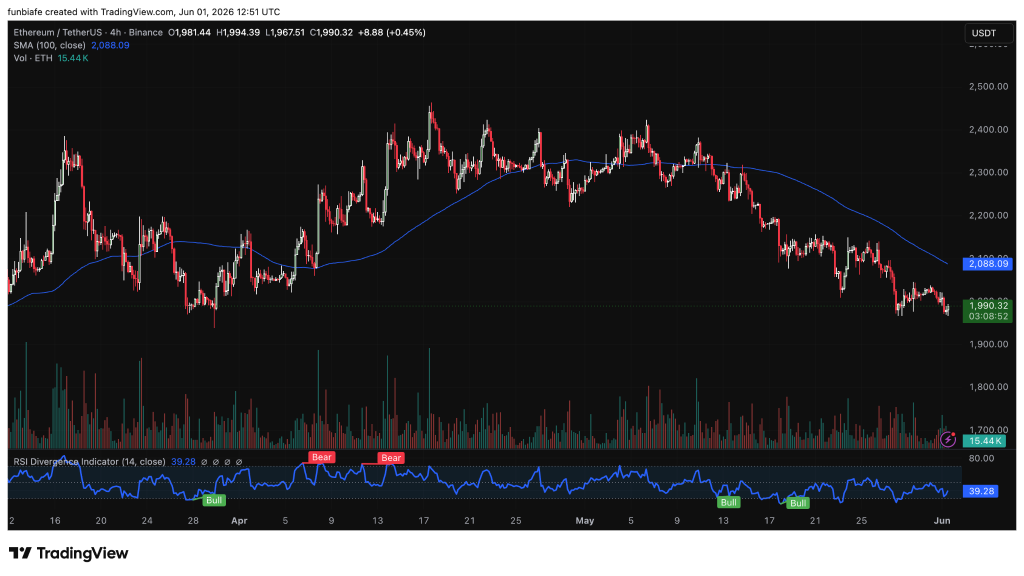
Volume is around 15.44K, which is moderate, but there hasn’t been strong buying activity behind recent green candles. That lack of conviction is one reason upside moves keep stalling. With RSI near oversold levels, a move back toward $2,050–$2,088 wouldn’t be surprising if buyers step in again.
That said, the bigger picture is still tilted bearish. As long as ETH stays below $2,088, the structure remains under pressure. A break and close above that level would be the first real sign that momentum is shifting. If ETH loses $1,950, things open up for a deeper drop toward $1,850–$1,900, which is the next major support zone on the chart.
Read Also: Crypto Price Prediction for Today, May 31: XRP, Worldcoin (WLD), and Ethereum (ETH)
ETH Upgrades, Regulation, and Whale Activity
Beyond price action, Ethereum’s future is being driven by its roadmap and adoption trends. The network has around seven planned upgrades through 2029, with two major ones lined up for 2026: Glamsterdam and Hegotá. Glamsterdam will primarily focus on enhancing the scalability of Ethereum, which means that there might be higher transaction throughput rates. If the upgrade succeeds, Ethereum might become even more suitable for developing applications because of increased efficiency.
Hegotá might come right after Glamsterdam, offering features like Verkle Trees. Such upgrades are aimed at making Ethereum work more efficiently without any loss of its high-level performance. In case the upgrades are successful, they can stimulate the use of Ethereum, which is likely to lead to increased demand for ETH tokens.
These focus on scaling improvements like parallel execution and data efficiency, which aim to push Ethereum toward much higher throughput levels. For the ETH price, this matters because better scalability usually means more usage, lower friction, and stronger demand for block space over time.
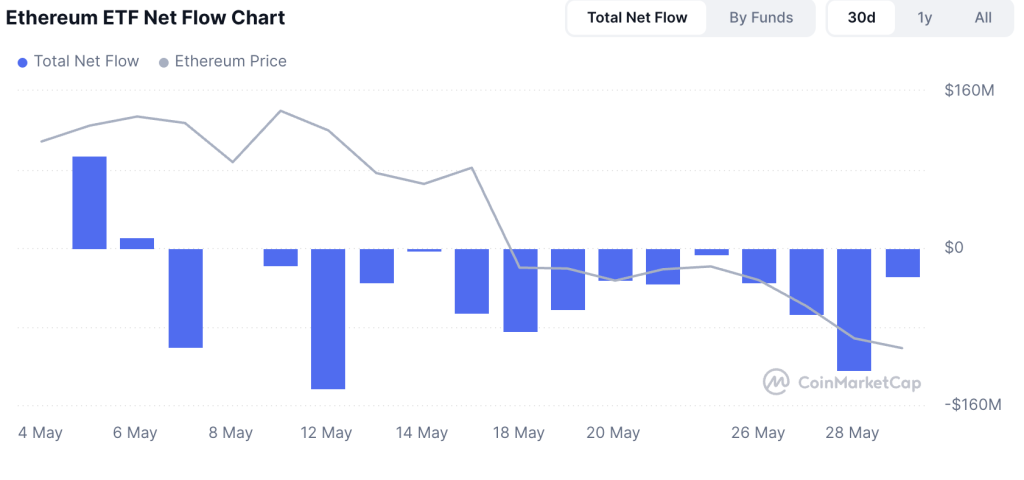
Institutional investors haven’t been helping the ETH price much either. During the May 25–29 trading week, spot Ethereum ETFs saw $241 million leave the market. Most of that came from BlackRock’s ETHA fund, which recorded $188 million in net outflows. And it wasn’t an isolated week. Ethereum ETFs have now posted 13 straight sessions of net outflows, with roughly $694 million pulled from these products. Looking across May, the pattern was fairly consistent, with more money leaving than coming in.
However, this alone does not indicate a bearish move for Ethereum, but it surely creates another obstacle for the bulls to overcome. If the institutional appetite wanes, then it will become more difficult for Ethereum to maintain momentum and generate positive moves. This is why most traders are paying close attention to ETF flow updates and economic data releases.
ETH Price Prediction for June 2026
June starts with ETH in a tricky position. The current ETH price is below $2,088 and creates pressure. At the same time, RSI is close to 39 and support is near $1,967-$1,990, allowing for an upward correction.
In case of dominance of sellers’ power, ETH might be trading in the range of $1,900-$2,050 until June. A neutral approach shows that ETH might be trading in a range of $1,950-$2,100. In case buyers succeed in capturing $2,088 with power, then the potential price target is $2,200.
ETH is currently located at an important level where the chart shows bearish sentiment. However, ETH is showing positive signs of upgrade and institutional investors in the long term, not letting the picture deteriorate.
FAQs
Subscribe to our YouTube channel for daily crypto updates, market insights, and expert analysis.