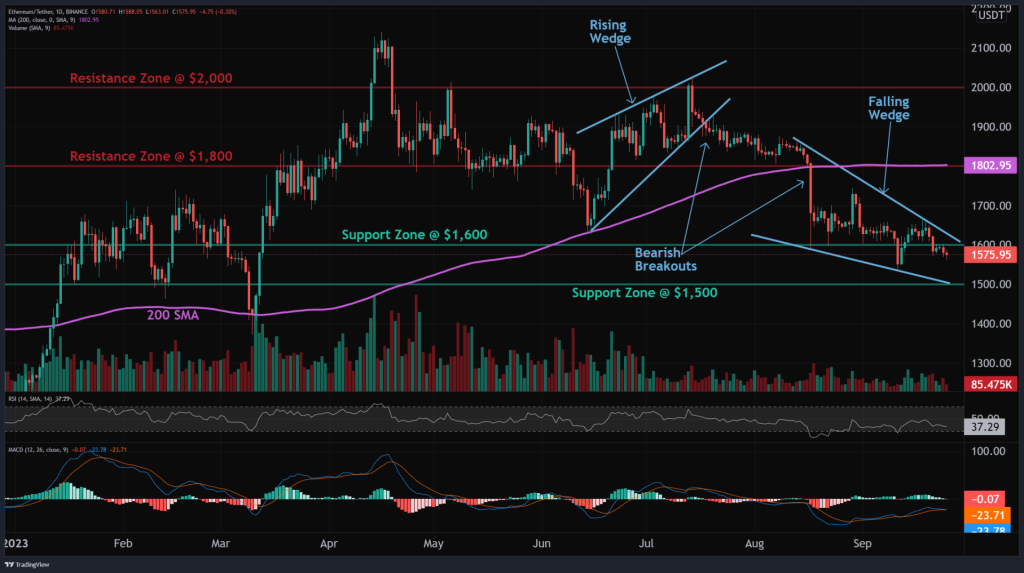
Ethereum (ETH) is currently trading around the $1,600 mark as the price struggles to break above this key zone.
According to the materials provided, Ethereum appears to be trading in a Falling Wedge pattern. A Falling Wedge is typically a bullish pattern, signaling that selling pressure is decreasing and the downtrend could reverse. When the price breaks above the upper trendline of the wedge, it often continues trending higher.
The materials suggest waiting for a definitive breakout above $1,600 before entering any bullish positions, as this would indicate buyers have absorbed the supply from sellers. The next key resistance levels to watch are $1,800 (previous support) and $2,000.
Source: altFINS – Start using it today
Looking at the momentum indicators, the MACD (Moving Average Convergence Divergence) line is above the signal line, which is bullish. However, the RSI (Relative Strength Index) is below 45, indicating weakening momentum. The declining MACD histogram bars also point to waning bullish momentum currently.
The overall trend across short, medium and long-term timeframes remains in a downtrend, according to altFINS analytics cited in the materials.
In terms of support, Ethereum has found buying interest around $1,600 recently. Below that, the next key support zone is around $1,500.
Is $2000 In Sight for ETH?
Given the current trading patterns and technical indicators, the possibility of Ethereum (ETH) breaking the $2,000 mark seems plausible, especially considering the Falling Wedge pattern, which is typically a bullish signal.
However, the market is showing mixed signals with the MACD line being above the signal line, indicating a bullish scenario, contrasted by the RSI and declining MACD histogram bars suggesting weakening momentum. The prevailing downtrend across various timeframes also adds a layer of uncertainty to the potential upward movement of ETH.
The key is to monitor the $1,600 and $1,800 levels closely for a definitive breakout, which would signify a strong buying pressure overcoming the selling pressure, potentially leading to a rally towards the $2,000 mark. The break above $2,000 would largely depend on the sustained buying interest and positive market momentum, and until then, it remains a critical level of resistance.
To summarize, Ethereum looks poised for a potential bullish breakout above $1,600 if buying pressure continues to increase. This could propel ETH towards resistance around $1,800. However, momentum indicators are showing mixed signals. Traders may want to wait for a convincing breakout before going long.

We recommend eToro
Wide range of assets: cryptocurrencies alongside other investment products such as stocks and ETFs.
Copy trading: allows users to copy the trades of leading traders, for free.
User-friendly: eToro’s web-based platform and mobile app are user-friendly and easy to navigate.