
Ethereum price has been struggling around the $2,000 range for some time, but a top analyst thinks the price might be close to making a bigger move.
The analyst, Crypto Patel laid out a detailed case for why ETH price could eventually reach between $10,000 and $15,000 during this market cycle. The argument was not built around hype or meme activity. Most of the discussion centered on institutional adoption, tokenized finance, ETF inflows, and Ethereum’s growing role inside traditional financial infrastructure.
That matters because Ethereum now looks very different from previous cycles. Earlier rallies were heavily tied to retail speculation and DeFi excitement. Recent developments show banks, asset managers, custodians, and financial firms steadily building products directly on Ethereum rails.
What you'll learn 👉
Ethereum’s Institutional Adoption Story Continues Expanding
Crypto Patel pointed to 10 major developments that support a long-term bullish Ethereum outlook. One of the biggest involved BlackRock filing for 2 tokenized money market funds tied to Ethereum infrastructure.
Those products are designed for stablecoin holders who want on-chain yield exposure. That detail matters because stablecoins continue becoming deeply connected to global digital payments. Ethereum benefits whenever institutions choose its network to settle or manage those products.
JPMorgan’s MONY Fund added another layer to the institutional narrative. The fund launched directly on Ethereum and reportedly started with $100 million in seed capital. Qualified investors can move funds and settle transactions around the clock through blockchain infrastructure instead of relying on traditional banking hours.
BlackRock’s BUIDL fund also continues expanding rapidly. Assets under management have climbed toward the $2.8 billion area. The fund now supports a large share of reserves tied to tokenized treasury products. That growth reinforces Ethereum’s position inside the real world asset sector.
Another development involves Robinhood building a Layer 2 network tied to Ethereum. The move could help the platform lower transaction costs for users without abandoning Ethereum security. Robinhood already controls a massive retail audience. A deeper Ethereum connection could strengthen ETH’s position in retail finance over time.
10 REASONS $ETH IS HEADING TO $10K-$15K THIS CYCLE 🚀
— Crypto Patel (@CryptoPatel) May 9, 2026
1️⃣ BlackRock Filing 2 Tokenized MMFs On Ethereum
2️⃣ JPMorgan's MONY Fund LIVE On ETHEREUM
3️⃣ BUIDL Hits $2.85B – Largest RWA On Earth
4️⃣ Robinhood Building Its L2 On Ethereum
5️⃣ Uniswap + Securitize Unlock BUIDL On-Chain
6️⃣… pic.twitter.com/fZjrLcgV0B
Ethereum ETFs And Institutional Holdings Continue Tightening Supply
Spot Ethereum ETFs also remain an important part of the bullish thesis. Crypto Patel noted that cumulative ETF inflows crossed $12 billion year to date. BlackRock’s ETH products reportedly attracted more than $175 million during the first week of May alone.
Large inflows matter because ETFs absorb circulating ETH from the market. Less available supply can increase volatility once buying demand accelerates.
Institutional accumulation continues outside ETFs as well. BitMine reportedly crossed 5 million ETH holdings. That figure represents more than 4% of Ethereum’s total supply.
Traditional finance infrastructure also keeps moving toward blockchain integration. DTCC has been testing tokenization systems tied to the Russell 1000 index. WisdomTree also launched a fully staked Ethereum ETP across European markets. Investors can gain ETH exposure and staking rewards inside one regulated product.
Taken together, these developments help explain why some analysts believe Ethereum could still have a much larger institutional phase ahead.
Ethereum Price Faces Key Resistance Levels Before Larger Breakout
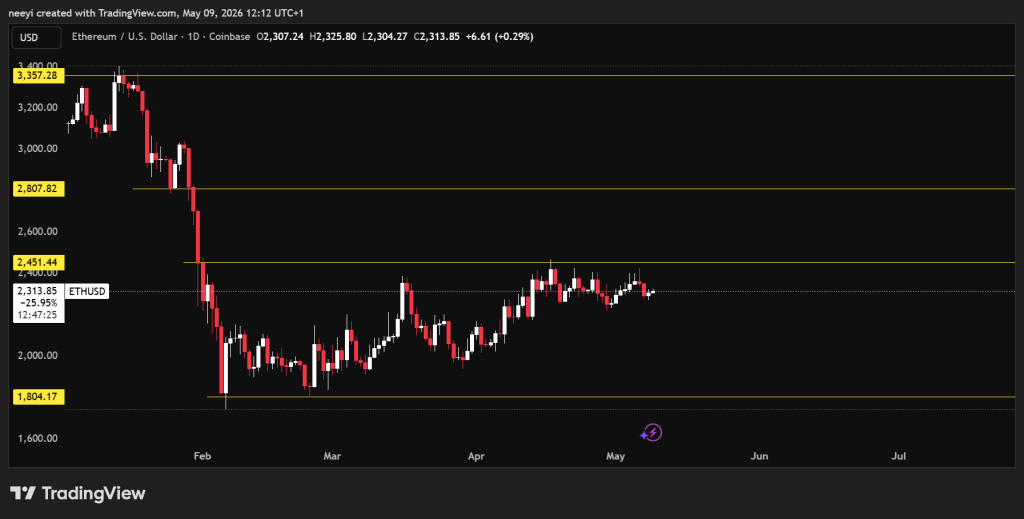
A look at the Ethereum price chart shows ETH trading near an important decision zone. Immediate resistance currently sits around $2,450. A clean break above that level could open the door toward $2,800.
The next major resistance area appears close to $3,350. That zone previously acted as a strong rejection region during earlier market cycles.
The attached chart from Crypto Patel also focuses heavily on repeated hammer candle formations across Ethereum’s long term structure. Earlier cycles showed similar candle setups before large upside expansions developed. The chart projects a possible path toward the $15,000 region if historical structure repeats over time.
Technical indicators currently present a mixed picture though. Some indicators support further upside continuation. Others still show weakness beneath the surface.
RSI currently sits around 52.255. That reading places ETH inside neutral territory and shows momentum has not fully tilted bullish or bearish yet. Stochastic readings also remain balanced near 50.46.
MACD and ADX readings lean bullish. MACD currently shows a buy signal near 26.51. ADX near 35.49 suggests trend strength is improving.
| Name | Metrics | Interpretation |
|---|---|---|
| RSI (14) | 52.255 | Neutral |
| STOCH (9,6) | 50.46 | Neutral |
| MACD (12,26) | 26.51 | Bullish |
| ADX (14) | 35.49 | Bullish |
| Ultimate Oscillator | 38.538 | Bearish |
| Bull/Bear Power (13) | -9.1662 | Bearish |
Other readings remain less convincing. Ultimate Oscillator metrics still lean bearish near 38.538. Bull and Bear Power also remains negative at -9.1662.
That combination explains why Ethereum technicals still look undecided despite improving institutional fundamentals.
Reads Also: Kaspa (KAS) Is Now Repeating Ethereum’s 2017 Pattern – Right Before ETH Did 50x
Ethereum now sits in an unusual position compared to earlier cycles. ETF inflows, tokenized assets, institutional custody products, and real world finance integrations continue expanding around the network. Price action still needs to clear major resistance zones before larger upside targets become realistic.
FAQs
Subscribe to our YouTube channel for daily crypto updates, market insights, and expert analysis.