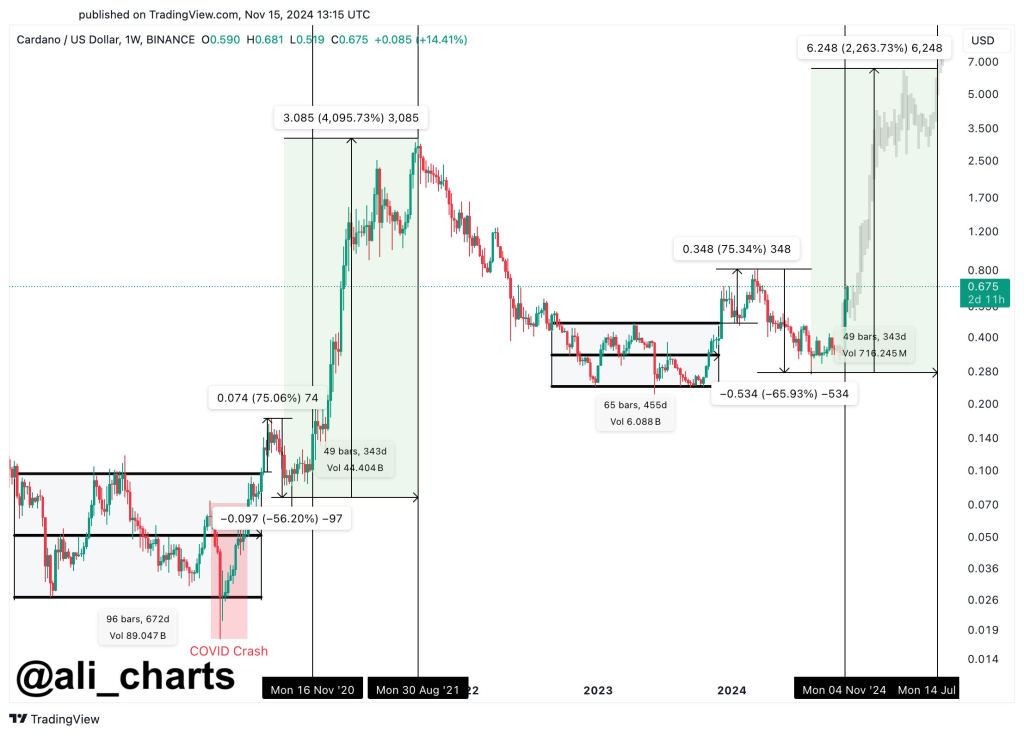
Cardano’s ADA is pumping today over 19% and is now trading $0.66. Analyst Ali Martinez updated his Cardano price forecast in the recent viral tweet.
Between 2019 and 2020, ADA traded within a rectangular price range, representing a strong accumulation zone that lasted for 96 bars (672 days). The COVID-19 crash in March 2020 caused a sharp 56.20% decline (-0.097 USD) within this range. However, ADA rebounded strongly, breaking out of the accumulation phase and reaching a peak of 4,095.73% (from approximately $0.074 to $3.085) in just 49 bars (343 days).
Second Accumulation Zone (2022-2023): Following the peak, ADA entered another accumulation phase from early 2022 to late 2023, where it traded within another rectangular range. This phase lasted 65 bars (455 days) and saw price fluctuations between -65.93% and a positive swing of 75.34%. This period indicates a consolidation and market indecision, as ADA faced multiple support and resistance retests.

Current Price Action and ADA Price Forecast (2024-2025)
The recent price action shows ADA attempting another breakout from the accumulation phase, potentially entering a new bullish cycle. Based on the projected price trajectory, if ADA follows the historical pattern of growth, it could reach $6.248 (2,263.73%) from its recent lows within a similar duration of 49 bars (343 days). This projection is highlighted in green, marking a potential peak around $6.248 by July 2025.
Support Zones: The initial support zone around $0.074 served as a foundation for the previous breakout. In the second accumulation, support was around $0.280 – $0.534. Current support likely lies around $0.590 or just below, where ADA might find stability if prices retrace.
Resistance Zones: Key resistance is projected around the $6.248 level if ADA mirrors its historical upward move. Other intermediate resistance levels are likely around prior peaks, particularly around $0.348 and $3.085.
Each major upward movement (highlighted in green) was preceded by increased volume, as shown in the volume boxes below each price action. For example, the previous surge from 2020 to 2021 had a volume of 4.404B, while the current move has a lesser volume of 716.245M. This potentially indicates a less intense but still significant bullish momentum in the current projection, although a volume increase could lead to faster price movement.
Read also: Solana (SOL) Eyes All-Time High: Is a $500 Price Target Within Reach?
The projected move to $6 aligns with a timeframe extending to mid-2025 (July or slightly beyond). If the Cardano price follows the previous cycle, this prediction assumes a significant bullish environment with potential external factors driving demand.
Subscribe to our YouTube channel for daily crypto updates, market insights, and expert analysis.
We recommend eToro
Wide range of assets: cryptocurrencies alongside other investment products such as stocks and ETFs.
Copy trading: allows users to copy the trades of leading traders, for free.
User-friendly: eToro’s web-based platform and mobile app are user-friendly and easy to navigate.


