Dogecoin (DOGE), the original meme crypto asset, has abruptly surged over 90% in the past two weeks. Now analysts spot striking similarities between current and historical price action, indicating another massive rally could ignite shortly. However, stretched technical readings show downside risks remain elevated.
What you'll learn 👉
Previous Vertical Explosions Follow Identical Pattern
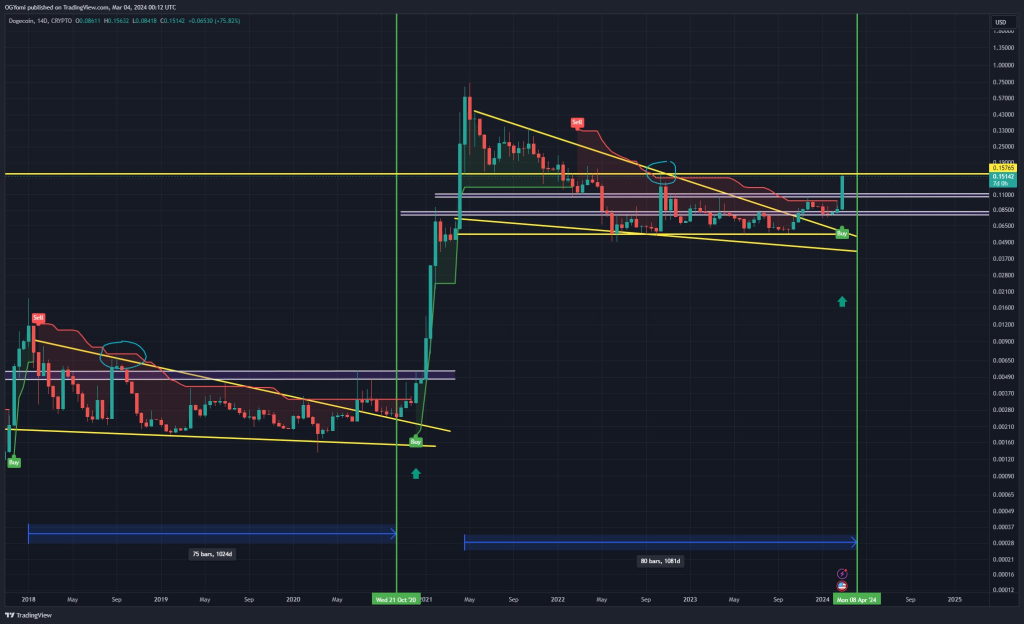
Veteran crypto chartist Yomi examines the Dogecoin daily timeframes, identifying extremely bullish technical developments he flags as an actionable trading catalyst in the past.
Specifically, Yomi notes the break of Dogecoin past the 14-day Super Trend indicator, coupled with a buy signal, and the surpassing of its previous local high, marked by blue circles on the chart. Historically, such patterns have been precursors to significant price rallies.

The Super Trend indicator, widely used for its simplicity and effectiveness in identifying the prevailing market trend, turning positive, is a strong signal for potential buyers. It suggests that Dogecoin could be entering a phase of upward momentum, reminiscent of its past surges following similar technical setups.
“The last time Dogecoin broke the 14 day Super Trend and flashed a buy signal while breaking its previous local high (Blue Circles) DOGE went vertical in the coming months after,” Yomi observed.
Doge2014 raises 500K in days celebrating Dogecoin. Make potentially big profits and get in on exclusive airdrop!
Show more +Extreme Greed Could Spark Sharp Reversion
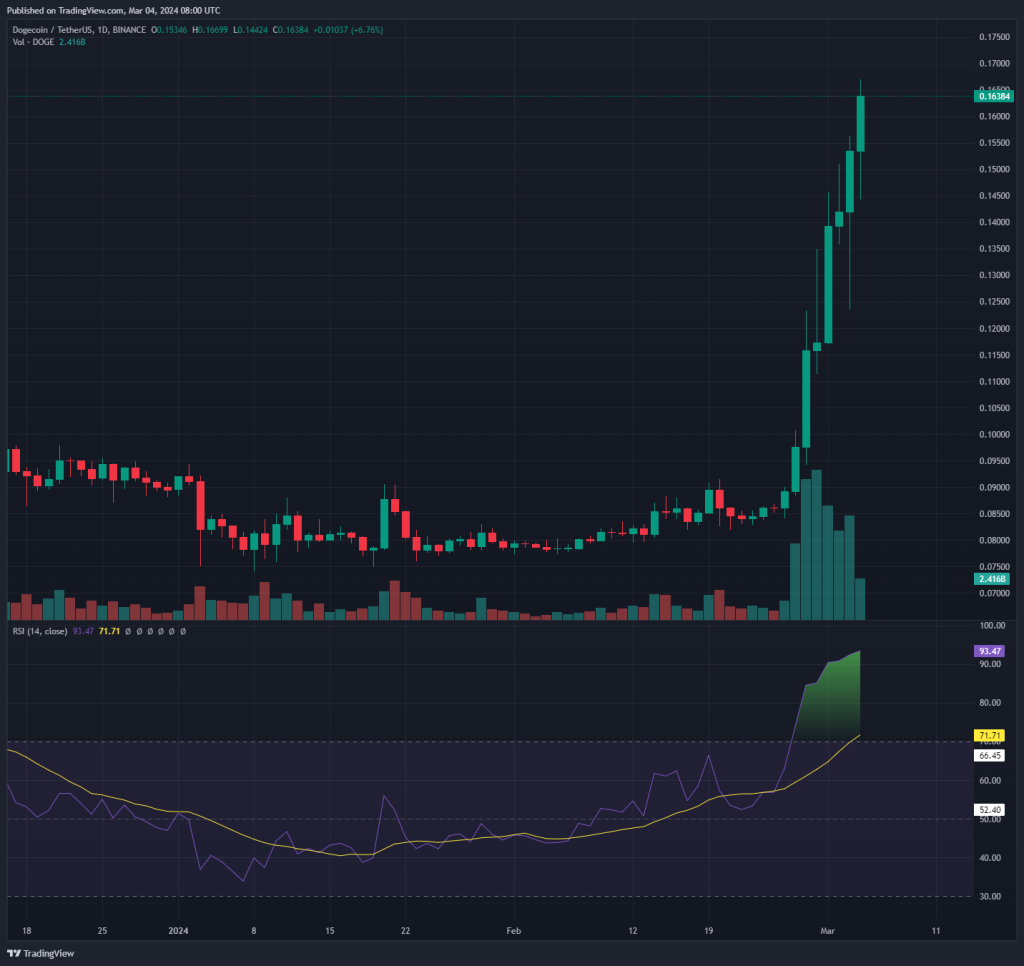
While clearly positive for Dogecoin’s outlook, seeing the RSI sustain unprecedented overbought readings above 93 simultaneously raises caution over downside whiplash once traders lose conviction.
Indeed as Yomi points out, “The Dogecoin daily RSI is almost tied for the highest it’s ever been.”
Readings this stretched often front-run devastating selloffs to rebalance sentiment – as seen in Dogecoin’s prior collapses from all time highs. Prudent traders must account for such risks amidst the greedy optimism.

RSI Explained: Quantifies Unsustainable Price Velocity
More broadly, for context, the relative strength index quantifies upside velocity by measuring the pace of recent price gains. Scales spanning from 0 to 100 indicate overbought conditions over 70, with extremes above 90 highlighting likely exhausted rallies.
This provides helpful perspective when contrasting past cycles reaching comparable euphoric peaks and subsequent drawdowns. By respecting overextended signals, investors avoid irrational exuberance infecting decision-making and instead rely on historically informed plans, accounting for the high volatility swings accompanying meme mania.
Dogecoin’s price performance further cements an optimistic outlook, with impressive gains across various time frames:
- 24 Hours: 23.9%
- 7 Days: 91.2%
- 14 Days: 90.4%
- 30 Days: 107.7%
- 1 Year: 113.8%
So in summary, analysts eye more upside still for Dogecoin, but informed participants increasingly eye stabilization opportunities before inevitable gravity strikes. Either way, towering volatility looks guaranteed as Doge reawakens animal spirits.
You may also be interested in:
- Polkadot (DOT) Is Now ‘Basically Open Air’ With No Near Term Resistance as ‘Epic Pump’ Begins, Top Analysts Set Their Targets
- Meme Coin Wave Lifts PEPE to New Heights, Price up Over 300% – But Here’s the Catch
- Can DeeStream (DST) Revolutionize Streaming as Ethereum (ETH) & Binance Coin (BNB) Surpass All-Time Highs for 2024
We recommend eToro
Wide range of assets: cryptocurrencies alongside other investment products such as stocks and ETFs.
Copy trading: allows users to copy the trades of leading traders, for free.
User-friendly: eToro’s web-based platform and mobile app are user-friendly and easy to navigate.


