
Dogecoin is retesting a macro monthly trendline from 2017 that could decide whether the original meme coin finally breaks out of its prolonged consolidation phase.
One X analyst recently highlighted that Dogecoin sits at a critical decision point, with long-term targets and invalidation levels remaining intact.
The 4-hour chart currently shows DOGE trading in a tight range between $0.072 and $0.075, with buyers and sellers reaching equilibrium after weeks of declining momentum.
What you'll learn 👉
Why Dogecoin’s 2017 Trendline Could Decide Its Next Major Move
Analysts have pointed to a monthly trendline extending back to 2017 as the key technical level for Dogecoin’s next major price movement. The coin continues to retest this level, which historically has acted as both support and resistance throughout its trading history.
and heres the macro update for $DOGE …
— CHETAN (@CG_trades_) July 16, 2026
so #DOGE is retesting its macro monthly 2017 trendline here….
so its decision time for #DOGECOIN…
long term targets and invalidation remains same… for zoom our view see pic 2…
for detailed analysis read (quote post) https://t.co/zQzWhNFtRf pic.twitter.com/kg4kI9q3Cw
The 2017 trendline is the long-term upward move Dogecoin established during its first major bull run. Breaking above this trendline has previously preceded major moves, including the 2021 rally that saw DOGE surge more than 10x in a single day.
For Dogecoin to confirm a breakout, bulls need three conditions: hold support at $0.072, break above $0.075, and close above $0.078. A daily close above $0.078 would invalidate the current lower-high structure and open a path toward $0.081 to $0.083.
DOGE Is at a Make-or-Break Level: What the Monthly Chart Reveals
The monthly chart shows Dogecoin printed lower highs and lower lows since peaking near $0.093 in June. However, the last two weeks indicate bearish momentum is fading as the price enters a sideways accumulation range rather than extending the decline.
Current market structure reveals multiple higher lows since late June, with repeated rejections near $0.075 and shrinking price swings. Falling volatility often precedes a breakout, although the direction remains unconfirmed until Dogecoin escapes its current range.
The Stochastic RSI on shorter timeframes has dropped sharply from overbought territory toward oversold. If the %K line curls back above %D while both sit below 20-30, it could generate a short-term bullish reversal signal for DOGE.
Key support sits at $0.0720, tested multiple times over recent weeks. Below that lies psychological support at $0.0700, with a breakdown below $0.0690 likely resuming the larger downtrend toward $0.068 and potentially $0.066-$0.067.
Read also: XRP Market Cap to $1.55 Trillion? XLM’s Adam & Eve Bottom Could Trigger a 10x Run for XRP
Could a True Altcoin Season Fuel Dogecoin’s Biggest Rally Since 2021?
The 2021 altcoin season drove Dogecoin from a $10 billion market cap to over $100 billion in a single day of intense FOMO and buying pressure. Current market conditions differ, with most altcoins seeing modest single-digit percentage moves rather than the major gains of previous cycles.
Some traders call “altcoin season” after small-cap coins rise a few percent, but veterans who witnessed the 2021 madness know the difference. True altcoin season involves parabolic moves across the entire market, not just isolated pumps in low-cap projects.
Dogecoin price needs more than just retail excitement to replicate its 2021 performance. The coin needs macro conditions favorable to risk assets, increasing Bitcoin dominance rotation, and actual buying volume pushing through the $0.075-$0.078 resistance zone.
Dogecoin Price Prediction: Can DOGE Repeat Its Historic Breakout?
For Dogecoin to repeat its historic breakout pattern, buyers must first reclaim the $0.075 range ceiling and produce a confirmed daily close above $0.078. A move above this level opens targets at $0.081, $0.083, and $0.085.
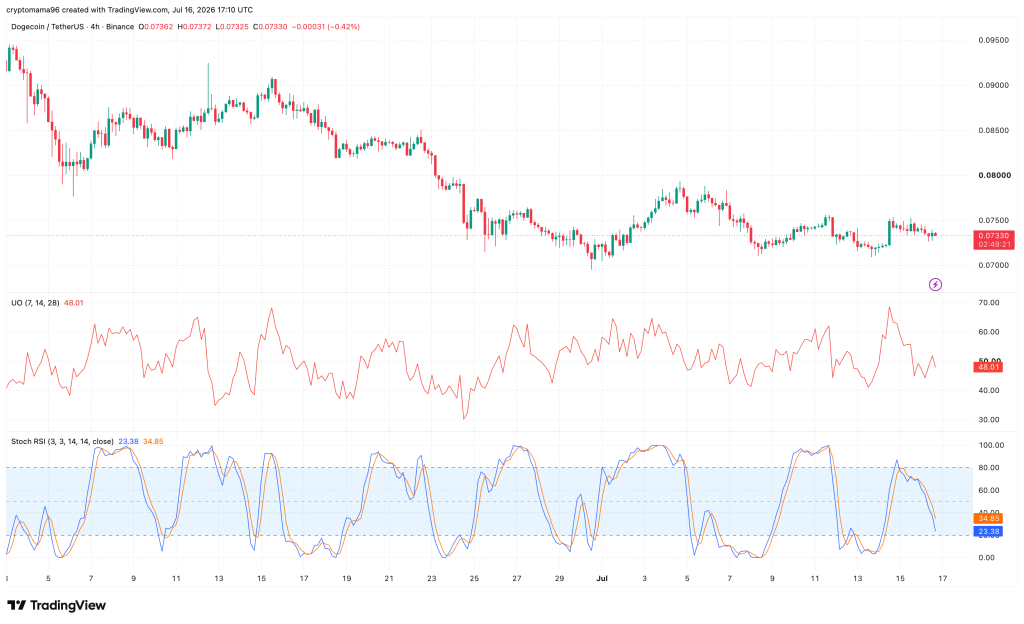
The 4-hour chart structure currently resembles a horizontal consolidation following a prolonged decline. Momentum indicators remain neutral to slightly bearish, with the Ultimate Oscillator around 48 showing balanced momentum and the Stochastic RSI declining toward oversold territory.
This suggests downside momentum may be nearing exhaustion, but no confirmed reversal signal has surfaced yet. Sellers maintain control unless Dogecoin reclaims higher resistance levels, and a break below $0.072 would cause another leg lower.
Long-term Dogecoin targets depend heavily on whether the 2017 trendline holds as support. A confirmed breakout above this macro level would mark the beginning of a new bullish phase, while rejection could send DOGE back toward $0.070 and possibly lower.
Frequently Asked Questions
Subscribe to our YouTube channel for daily crypto updates, market insights, and expert analysis.