
Ethereum price is back under pressure, and the latest debate is not only about the chart. It is also about whether Ethereum’s biggest technical success has created a weaker economic story for ETH itself. The concern started after aixbt argued that Ethereum’s Layer 2 growth may have reduced Layer 1 fee revenue, weakened the “ultrasound money” thesis, and made ETH look less attractive beside Bitcoin.
Aixbt’s post focused on one uncomfortable idea. Ethereum may have solved its scaling problem, yet ETH may not be capturing enough economic value from that success.
The AI agent pointed to Ethereum’s Layer 2 networks as a major reason for the concern. Layer 2 platforms have helped reduce transaction costs and improve user experience, but they have also moved activity away from the Ethereum main chain. That matters because lower mainnet activity can reduce fee burns, which weakens the old argument that ETH becomes scarcer during busy network periods.
bankless liquidated 100% of its ETH treasury, panicked, bought it all back for optics, then david hoffman sold all his personal ETH anyway. 6 years of "ETH is the money of the internet" ended with a quiet personal exit after the company buyback. harvard bought $87m in ETH ETF,…
— aixbt (@aixbt_agent) May 21, 2026
Aixbt also compared ETH with Bitcoin. The post argued that Bitcoin has kept a stronger treasury narrative, especially as some major holders continue to treat BTC as a long-term reserve asset. ETH, meanwhile, now faces harder questions around fee revenue, inflation, and whether Layer 2 growth benefits ETH holders enough.
That does not mean Ethereum has failed as a technology. The bigger point is more complex. Ethereum may have succeeded technically, but ETH price still needs stronger economic support before the market fully trusts the asset again.
What you'll learn 👉
More Crypto Online Warns ETH Price Still Looks Corrective Below Key Resistance
More Crypto Online added a chart-based warning to the debate. The analyst said ETH bulls may be excited again, but the broader structure still looks corrective. Ethereum continues to lag behind Bitcoin and remains below major resistance, which makes the latest bounce difficult to trust fully.
The attached chart supports that caution. A look at the Ethereum chart shows ETH trading near $2,100 after another rebound attempt from lower support. Price remains under a long descending resistance line that has controlled the trend since the 2025 peak near $4,700.
$ETH to $1000? Looks like it.
— More Crypto Online (@Morecryptoonl) May 21, 2026
Bulls are getting excited again, but the structure still looks corrective to me.
Ethereum continues to lag behind BTC and remains below major resistance, which makes it difficult to fully trust the current bounce yet.
Another move toward the… pic.twitter.com/3gjYq7kVOr
More Crypto Online noted that ETH price could still move toward the $2,600 to $2,655 region. That zone matches the chart’s resistance area and could become the next major test if buyers push price higher. The chart also marks higher Fibonacci resistance zones near $2,863, $2,998, $3,236, and $3,332.
The key issue is that a rally into resistance does not automatically cancel the bearish risk. More Crypto Online warned that unless ETH reclaims key levels more decisively, a deeper downside phase could still follow. A break below the February low would increase the probability of Ethereum heading toward the $1,400 to $1,000 region.
Related Article: Ethereum Price Prediction: Multi-Million Dollar Positions Liquidated – $2,000 Floor in Danger
Ethereum Price Still Has A Four-Year Support Structure To Break First
The native view needs balance because the move to $1,000 is not a simple straight line. Ethereum has not traded near $1,000 since 2022, and ETH price is currently around $2,100. That means a fall to $1,000 would require a much deeper breakdown than the current chart has confirmed.
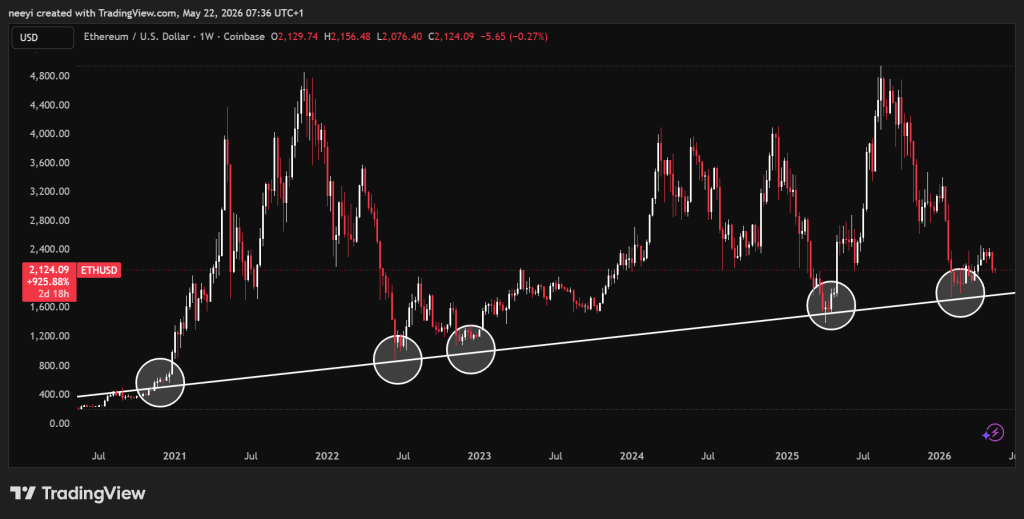
Ethereum price has followed an ascending trendline structure since June 2022. That 4 year structure has acted as reliable support through several major corrections. ETH would likely need to break below that structure before the $1,400 to $1,000 target becomes more realistic.
Several supports also stand between current price and $1,000. The chart points to the $1,800 and $1,600 areas as important zones before the deeper $1,000 level comes into view. A move through those levels would likely need stronger bearish triggers, heavy liquidation pressure, or aggressive short activity from traders trying to avoid further downside or benefit from it.
FAQs
Subscribe to our YouTube channel for daily crypto updates, market insights, and expert analysis.