Crypto Price Predictions for Today, October 1: Ethereum (ETH), Bitcoin (BTC), and Cardano (ADA)


Ethereum, Bitcoin, and Cardano begin October with a familiar challenge: their recent sideways trading has continued without a clear breakout. Ethereum and Cardano have remained inside established ranges since September 23, and Bitcoin also needs stronger momentum to move away from its current trading area.
Today’s crypto price predictions depend on whether buyers can turn modest strength into a sustained recovery. The indicator readings offer some encouragement, although they do not all point in the same direction. Each token has nearby levels that could help distinguish another day of sideways trading from a more decisive move.
What you'll learn 👉
Ethereum Price Remains Between $2,600 And $2,800 As Momentum Stays Mixed
Ethereum price has traded mainly between $2,600 and $2,800 since September 23. That repeated movement makes the range boundaries useful reference points for October 1.
The longer ETH remains inside this band, the more important a sustained break becomes. A brief move above resistance would offer less confirmation than a breakout that holds after sellers test it again.
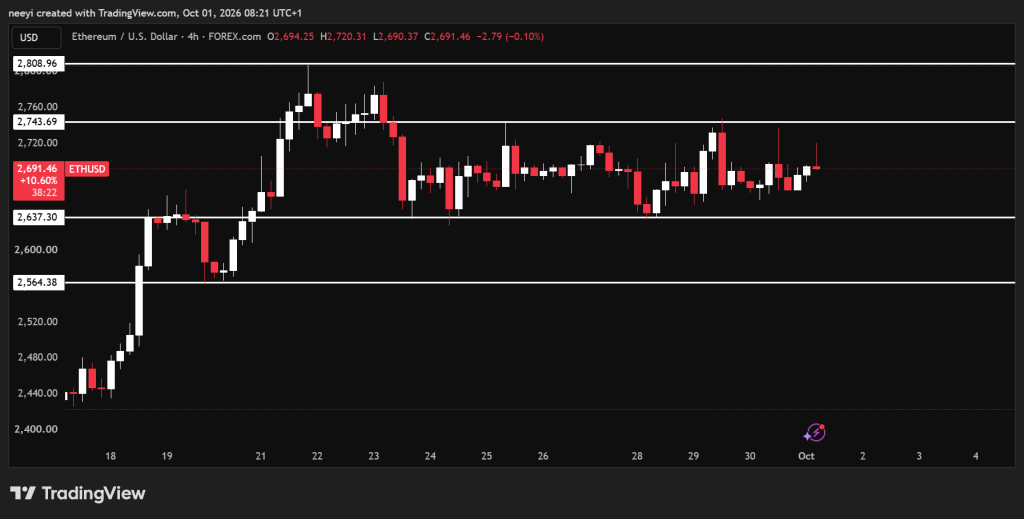
Ethereum’s immediate upside challenge is therefore $2,800. A move through that level could open the way toward $2,900 if buying pressure continues. The lower boundary at $2,600 remains the main support to watch, with $2,500 becoming a possible downside target if that support fails.
Ethereum Indicators Show Buying Strength Without Full Momentum Confirmation
Ethereum’s RSI reading of 56.384 places it above the midpoint of 50. This gives buyers a modest advantage, although the reading does not indicate unusually strong upward momentum. ETH has room to climb before the RSI reaches the commonly used overbought threshold of 70.
The MACD reading of −0.44 offers a less positive view. Its negative value means this indicator has not confirmed the strength visible elsewhere. That disagreement matters because a recovery can struggle when buying pressure improves before broader momentum follows.
The Ultimate Oscillator stands at 53.751, slightly above its midpoint. This supports the possibility of upward movement, but the reading remains relatively moderate.
Bull/Bear Power is positive at 23.6239. That supports the view that buyers have some control, although Ethereum price still needs to clear resistance before that strength produces a breakout.
| Indicator | Value | What The Reading Means |
|---|---|---|
| RSI (14) | 56.384 | Buyers have a modest momentum advantage. |
| MACD (12,26) | −0.44 | Negative momentum limits confirmation of an upward move. |
| Ultimate Oscillator | 53.751 | Buying pressure holds slightly above the midpoint. |
| Bull/Bear Power (13) | 23.6239 | Positive pressure supports buyers inside the range. |
Ethereum Price Prediction For Today
Ethereum’s readings lean positive overall, but the negative MACD keeps the outlook mixed. The $2,800 boundary is the clearest test of whether buyers can move beyond the recent pattern.
- Bullish scenario: Ethereum price breaks above $2,800 and holds that level, which could allow a move toward $2,900 before the day ends.
- Neutral scenario: ETH continues between $2,600 and $2,800 as neither side develops enough strength to force a sustained breakout.
- Bearish scenario: Ethereum retests $2,600, and a sustained break below support could extend the decline toward $2,500.
Bitcoin Price Needs Stronger Momentum To Move Beyond $82,685
Bitcoin price is trading around $82,685, but the supplied figures do not establish a complete trading range. The nearby $82,600 level provides the immediate downside reference for today’s outlook.
BTC could remain close to its current trading area if momentum stays limited. Buyers need a stronger move to support the proposed $87,000 upside scenario, which would require more than a small recovery from the current level.
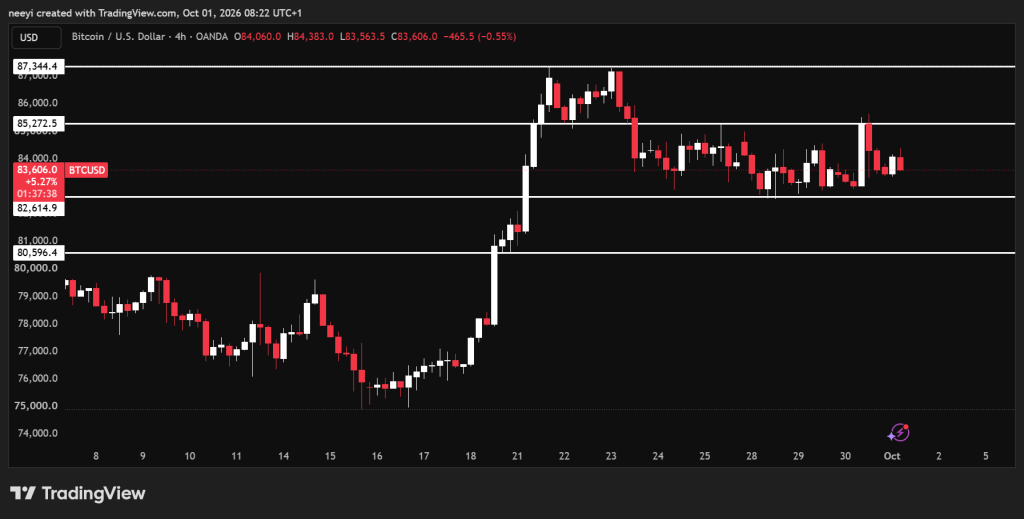
The bearish path starts with a loss of $82,600. A brief dip below that level would need follow through before the lower target of $80,600 becomes more likely. Bitcoin’s ability to reclaim support after any initial drop will therefore matter.
Bitcoin Indicators Show An Uneven Balance Between Buyers And Sellers
Bitcoin’s RSI is 53, which places it only slightly above the midpoint. This reading offers a small positive bias, but it does not establish a strong directional trend.
The MACD value of −93.5 points to negative momentum. That weakens the case for an immediate upward breakout, particularly when the RSI remains close to neutral.
The Ultimate Oscillator reading of 49.803 reinforces the lack of a clear advantage. Its position just below 50 indicates that buying pressure has not firmly taken control through this measure.
Bull/Bear Power provides the more encouraging reading at 511.9498. The positive value indicates buyer strength, but the other indicators do not fully confirm it. These values also use different scales, so their numerical sizes should not be compared directly.
| Indicator | Value | What The Reading Means |
|---|---|---|
| RSI (14) | 53 | Momentum remains close to balanced with a small positive bias. |
| MACD (12,26) | −93.5 | Negative momentum weighs on the breakout outlook. |
| Ultimate Oscillator | 49.803 | Buying pressure remains near the midpoint without clear control. |
| Bull/Bear Power (13) | 511.9498 | Buyers show strength that needs wider momentum confirmation. |
Bitcoin Price Prediction For Today
Bitcoin’s mixed readings leave sideways trading as a reasonable scenario. A stronger directional move would need confirmation from price itself.
- Bullish scenario: Bitcoin develops sustained buying pressure and moves beyond its current trading area, which could bring $87,000 into view before the day ends.
- Neutral scenario: BTC remains close to $82,685 as limited momentum prevents a decisive move in either direction.
- Bearish scenario: Bitcoin loses $82,600 and fails to reclaim it, which could allow a deeper decline toward $80,600.
Cardano Price Tests The Upper Part Of Its $0.235 To $0.26 Range
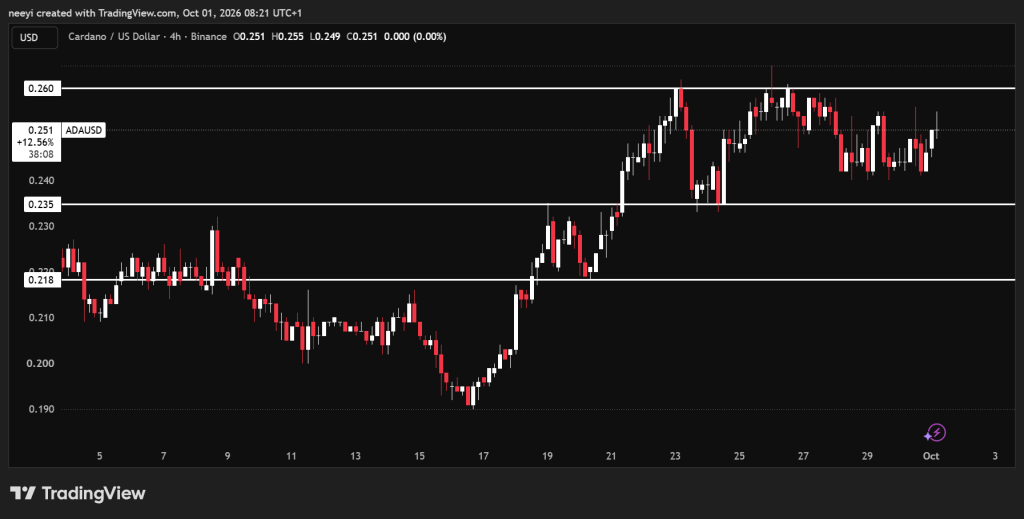
Cardano price has also traded sideways since around September 23. Its main range extends from $0.235 to $0.26, with ADA currently around $0.254.
That puts Cardano closer to resistance than support. Buyers therefore have a nearby opportunity to test $0.26, but reaching that boundary and sustaining a breakout are separate steps.
A confirmed move above $0.26 could open the way toward $0.28. Failure to break resistance could keep ADA inside the established range. The downside outlook becomes weaker if price loses $0.235, with $0.21 becoming a possible next target.
Cardano Indicators Lean Positive But MACD Offers Limited Detail
Cardano’s RSI reading of 56.189 gives buyers a moderate momentum advantage. Similar to Ethereum, it remains below the commonly used overbought threshold, so this indicator does not show an overstretched rally.
The Ultimate Oscillator is 57.925, which supports the positive bias. Both readings indicate some buying strength, although neither guarantees that resistance will break.
Cardano’s MACD is displayed as 0 despite the supplied bullish classification. A zero reading alone cannot confirm strong upward momentum. The displayed figure may also conceal smaller decimal differences, so it provides limited directional detail.
Bull/Bear Power is positive at 0.0028. That adds support to the buyer advantage, but ADA still needs a sustained move above $0.26 to turn these readings into a clearer price recovery.
| Indicator | Value | What The Reading Means |
|---|---|---|
| RSI (14) | 56.189 | Buyers hold a moderate momentum advantage. |
| MACD (12,26) | 0 | The displayed value offers limited directional confirmation. |
| Ultimate Oscillator | 57.925 | Buying pressure supports a positive bias. |
| Bull/Bear Power (13) | 0.0028 | Positive pressure gives buyers some support. |
Cardano Price Prediction For Today
Cardano has a modest positive bias and trades near its upper range boundary. The response around $0.26 should help clarify whether today brings a breakout or another range test.
- Bullish scenario: Cardano price breaks above $0.26 and holds the level, which could support a move toward $0.28.
- Neutral scenario: ADA continues between $0.235 and $0.26 as resistance limits further progress.
- Bearish scenario: Cardano falls below $0.235 and fails to recover support, which could expose $0.21 before the day ends.
FAQs
Subscribe to our YouTube channel for daily crypto updates, market insights, and expert analysis.