
Where could the XRP price be headed latter this year? One of the leaders of Ripple community on X ‘EGRAG CRYPTO’ just updated his XRP price forecast
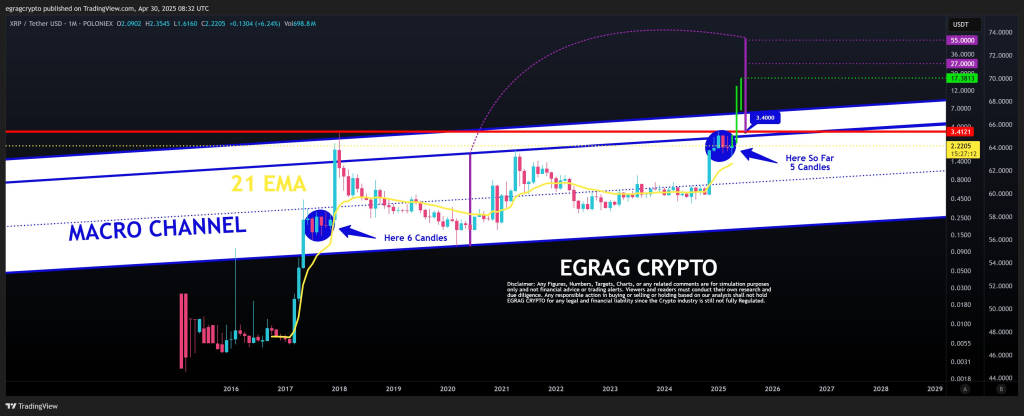
EGRAG’s chart shows the XRP price moving within a clear ascending channel since 2017. This channel creates important support and resistance zones that have contained XRP’s price movements for years.
The 21-month Exponential Moving Average (EMA) appears as a yellow line on the chart, acting as a dynamic support or resistance level. Historically, XRP has gained significant momentum after closing firmly above this EMA. The first major breakout in 2017 came after 6 months of compression around this EMA.
Currently, XRP has shown 5 monthly candles consolidating above the EMA, potentially mirroring the setup from the previous cycle. The chart directly compares the 6-candle consolidation pattern from 2017 with the current 5-candle consolidation happening now.
Price Targets and Strategy
EGRAG identifies several key price levels in his analysis. The $3.40-$3.41 range represents a critical resistance level from the 2018 cycle peak. Breaking above this would confirm a significant macro shift for XRP.
The analyst suggests $17.38 as a primary target based on historical patterns and projection within the macro channel. This level aligns with the upper boundary of the long-term channel.
More ambitious projections at $27, $36, and $55 appear as purple dotted lines on the chart. These represent extended breakout targets if XRP were to break above the macro channel entirely.
| Element | Detail |
|---|---|
| Chart Type | Monthly (Macro View) |
| Trend | Ascending within macro channel |
| EMA | 21 EMA holding as support |
| Candle Fractal | 6-month compression pattern repeating from 2017 |
| Key Resistance | $3.40 (cycle high), $17.38 (channel top), $27/$36/$55 (extended) |
| Key Support | $1.40 horizontal, 21 EMA dynamic, $0.50 long-term base |
| Sentiment | Bullish structure, watching for breakout confirmation |
| Strategy | Gradual scaling out from $17–$27–$55 as targets hit |
In his accompanying tweet, EGRAG notes: “We’re currently in Candle number 5, and if history is any guide, we could be looking at a MEGA Monthly Candle!” This suggests he believes XRP might mirror its 2017 pattern, where the sixth candle marked the breakout point.
The analyst mentions a gradual selling strategy rather than exiting all at once, showing a disciplined approach to potential profits. “I have my eyes set on $27, but I plan to sell gradually as prices rise,” he states.
Current price at the time of the post sits at $2.22, already above the 21 EMA. The price appears to be compressing near the upper macro channel, which technical analysts often view as a potential pre-breakout zone.
Support levels include $1.40 (previous resistance turned support) and the 21 EMA around $1.80-$2.00, which would serve as first dynamic support if price pulls back.
Read also: We Asked AI to Predict Ripple (XRP) Price in May
Subscribe to our YouTube channel for daily crypto updates, market insights, and expert analysis.

We recommend eToro
Wide range of assets: cryptocurrencies alongside other investment products such as stocks and ETFs.
Copy trading: allows users to copy the trades of leading traders, for free.
User-friendly: eToro’s web-based platform and mobile app are user-friendly and easy to navigate.