Ripple price is starting to show momentum again and this time it is looking to spike above its last all time high. An analyst on X identifies the current price pattern and thinks the price could be going much higher this time.
The analyst is Rand, known as @crypto_rand on X. He asks a simple question that sets the tone for the chart: is XRP ready to smash the $6 range.
Rand is looking at the three day chart. Price broke out strongly in July and then pulled back in a neat falling channel. That pullback ended with a breakout to the upside, which often tells traders that the trend wants to continue.
Right after the breakout, XRP formed a small pause just under a horizontal level near $3.50. The candles show buyers stepping in on each dip and keeping price above the mid range support around $2.70.
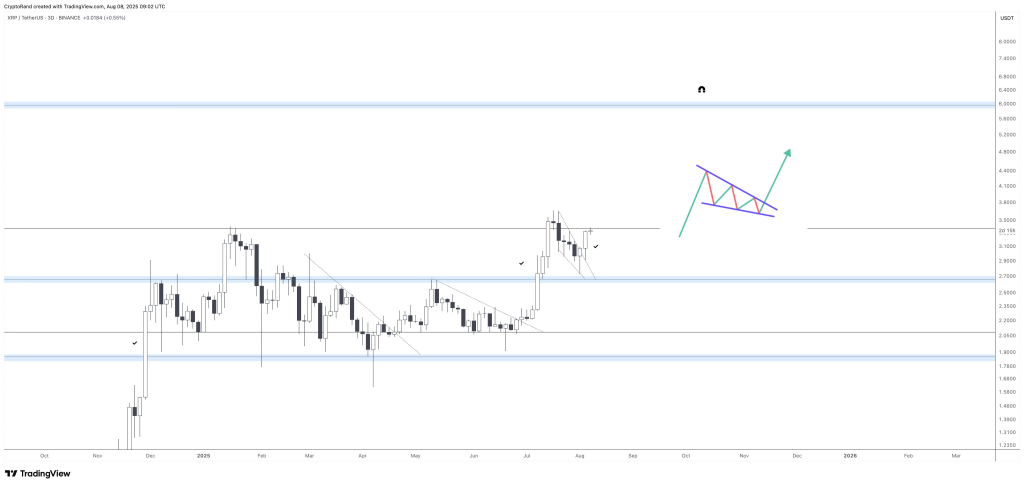
On the right side of the chart, Rand draws a simple sketch of a falling wedge. That sketch explains his idea. He expects a brief series of lower highs and higher lows that compress price. When wedges like this break, they often release built up energy. His arrow points up from the wedge toward the next resistance cluster. In his view that path opens the door to the $6 area.
Key Levels To Watch for XRP Price
The chart carries three clear zones. The first is support around $2.00 where previous consolidation held for weeks. Buyers defended that area more than once, which makes it a base.
Above that sits a mid zone near $2.70 to $2.80. XRP reclaimed this zone during the July breakout and then retested it during the pullback. That successful retest is marked on the chart and it matters because it turns old resistance into new support.
The third is the ceiling near $3.40 to $3.60. Price is pressing right under it as the latest candles show. A daily and then weekly close above that band would confirm that momentum is back. If bulls clear this band with strength, the next wide open zone on Rand’s chart stretches toward $6.
He places a light blue resistance band up there to show where the next heavy supply sits. It lines up with a prior major range from the last cycle and with a round number that many traders watch.
Read Also: Time to Sell Kaspa? Indicators ‘Scream’ Yes
How A Run To $6 Could Unfold
Rand’s tweet is short but direct. He asks if XRP is ready to smash the $6 range. The chart explains why he thinks this is possible. The market has already shifted from a long period of sideways price action to a pattern of higher lows.
Breakouts, flags, and wedges are stacking in the same direction. Each pullback is shallower than the one before. That is the kind of behavior that often happens before a larger expansion move.
In this script, XRP would compress inside a wedge just under $3.50. Liquidity builds as traders place stops above the local highs. A clean break above the wedge unlocks those stops and pushes price into the empty space between $3.60 and $5.00. If momentum carries and there is no sharp rejection, price can grind through that space and test the heavy band near $6.
Subscribe to our YouTube channel for daily crypto updates, market insights, and expert analysis.