Something interesting is brewing on the Cardano chart and its worth taking a look at. The ADA price has spent most of the year trading inside a tightening pattern, but things might be about to change.
A crypto Analyst Ali on X mentioned that the price action shows a long period of compression that often leads to strong breakouts, and that the chart now hints that ADA price could be setting up for a powerful rally.
What you'll learn 👉
Cardano Price Squeeze Could Signal the Start of a Big Move
According to Ali’s chart, ADA has been stuck in a symmetrical triangle since early 2024. Each rally hits resistance at the top, and each drop finds buyers at the bottom. The swings are getting smaller, building pressure for a big move soon.
On the latest chart shared by Ali, Cardano token is pressing right at the lower boundary of the pattern, around $0.77. The structure looks like it’s nearing its final stage before deciding where to go next.
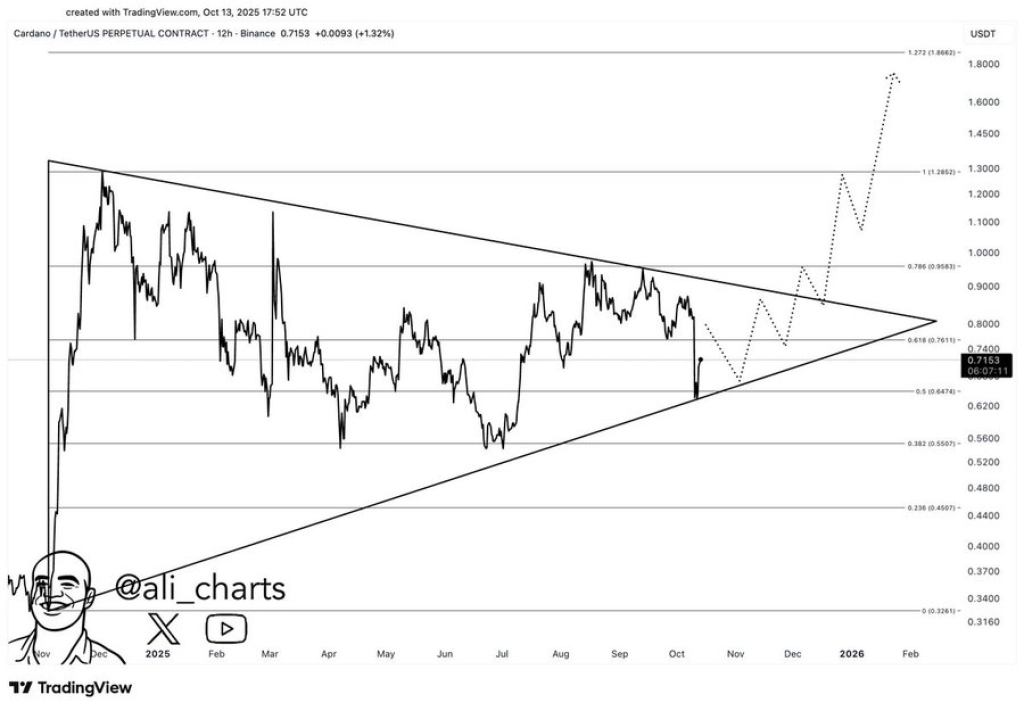
The projection from the chart shows that once ADA climbs above $0.90, a breakout could extend toward $1.88 roughly a 2x jump from where it is now.
The pattern shows a classic technical setup. When prices tighten inside a wedge, it signals incoming volatility. If momentum builds and ADA stays above the breakout level, the move could happen in stages. Prices may pause around $1.10 and $1.30 before aiming for $1.88.
Technical Indicators from Investing.com Show a Mixed Picture
The triangle pattern looks promising but the technical indicators on Investing.com’s daily chart paint a more cautious picture.
Momentum signals are still weak, suggesting the market hasn’t fully shifted gears yet. Below is the snapshot from October 15, 2025:
| Name | Value | Action (Description) |
| RSI(14) | 41.098 | Shows weak buying strength. |
| STOCH(9,6) | 66.281 | Shows mild buying pressure. |
| MACD(12,26) | -0.041 | Trend still looks bearish. |
| ADX(14) | 15.423 | Market has low strength. |
| CCI(14) | -59.3922 | Sellers are in control. |
| Highs/Lows(14) | -0.0152 | Price is still falling. |
| ROC | -16.387 | Momentum is going down. |
These numbers show that short-term momentum is still weak. RSI and MACD suggest traders should stay cautious. The stochastic indicator hints that buyers are slowly returning. If ADA holds above $0.80 and gains strength, sentiment could change fast.
Could ADA Be Ready for a 2x Rally?
The story here is one of patience and timing. Cardano has spent months building a solid base, and the market is waiting for confirmation. If the ADA price breaks above $0.90 with strong volume, it might unlock that higher range near $1.88, as shown in the chart.
Read Also: Chainlink (LINK) Maintains Super Bullish Structure Despite Market Turbulence
Both the triangle pattern and Fibonacci levels point to that price as a realistic bullish target.It’s unclear if this is the start of a long-term trend or just another short rally. For now, ADA is sitting on key support while traders watch volume and momentum for clues.
Subscribe to our YouTube channel for daily crypto updates, market insights, and expert analysis.