Chainlink Price Prediction as LINK ETF Inflows Grow and Another Major Integration Goes Live


Chainlink has entered an interesting period where developments around the network are moving faster than the LINK price itself. Spot LINK ETFs have recorded several consecutive days of net inflows, and another protocol has now adopted Chainlink infrastructure for real world asset pricing.
LINK price has not produced a decisive breakout despite those developments. The token has spent much of its recent price action between $10.80 and $12.50, which leaves both a recovery and another decline possible from current levels.
That makes the next move particularly important. ETF demand and growing use of Chainlink provide a stronger fundamental backdrop, but the LINK price still needs to clear several technical levels before a much larger recovery becomes realistic.
What you'll learn 👉
LINK ETFs Record 7 Straight Days of Net Inflows
Institutional exposure to Chainlink continues to increase through spot LINK ETFs.
BSCN reported that spot Chainlink ETFs have recorded net inflows for 7 consecutive days. The products opened this week with another $2.68 million in net inflows after recording $13.35 million throughout the previous week.
Seven straight days of net inflows to spot $LINK ETFs.
— BSCN (@BSCNews) August 25, 2026
Spot @Chainlink ETFs now hold 1.99% of $LINK's current supply – That's basically 1 in every 50 $LINK tokens.
The products started this week with +$2.68M in net inflows, following a +$13.35M performance throughout last week.… pic.twitter.com/GF4zvereUZ
Perhaps the more interesting figure concerns how much LINK these products now control.
Spot LINK ETFs collectively hold around 1.99% of Chainlink’s current supply. Put differently, roughly 1 out of every 50 LINK tokens is now held through these products.
That percentage could become increasingly relevant if ETF inflows continue. More LINK entering ETF products means a larger portion of the existing supply becomes associated with investment vehicles instead of remaining freely available across the broader market.
ETF accumulation alone does not guarantee that the Chainlink price will increase. However, continued inflows alongside greater network usage could create an interesting combination if demand for LINK expands further.
Chainlink is also getting support from developments elsewhere in its ecosystem.
Metric Uses Chainlink Data Streams for Tokenized Stocks and Commodities
Newly launched decentralized exchange Metric has selected Chainlink Data Streams as its price oracle infrastructure.
Metric offers pools for tokenized stocks, commodities and other real world assets. Chainlink Data Streams provides the live reference prices required for those markets.
The integration becomes more notable because Metric says it processed $10 billion in volume during its stealth period.
Metric is also part of a broader collection of protocols developing on Robinhood’s blockchain. Chainlink infrastructure has served as the official oracle layer there since the network’s mainnet debut in July.
Chainlink lands another DEX as Metric goes live
— BSCN (@BSCNews) August 25, 2026
Newly launched Metric uses @chainlink Data Streams as its price oracle, with pools that trade tokenized stocks, commodities, and other real-world assets around live reference prices. @metricxyz says it processed $10B in volume… pic.twitter.com/DPHBZP6HX5
Oracle infrastructure plays an important role when blockchain applications need reliable market information from outside their own networks. Tokenized stocks and commodities especially require accurate reference prices because their values depend on assets traded in traditional markets.
Chainlink Data Streams gives protocols access to market data that can then be used to price these assets onchain.
The combination of ETF accumulation and additional integrations gives LINK 2 separate developments to watch. Price action, however, still has some work to do.
Chainlink Price Prediction Depends on the $10.80 to $12.59 Range
A look at the Chainlink price chart shows LINK trading inside an important range after several volatile sessions.
LINK has moved mainly between $10.80 and $12.50. The boundaries of this range could determine whether the next major move takes the price toward higher resistance or sends it back toward earlier levels.
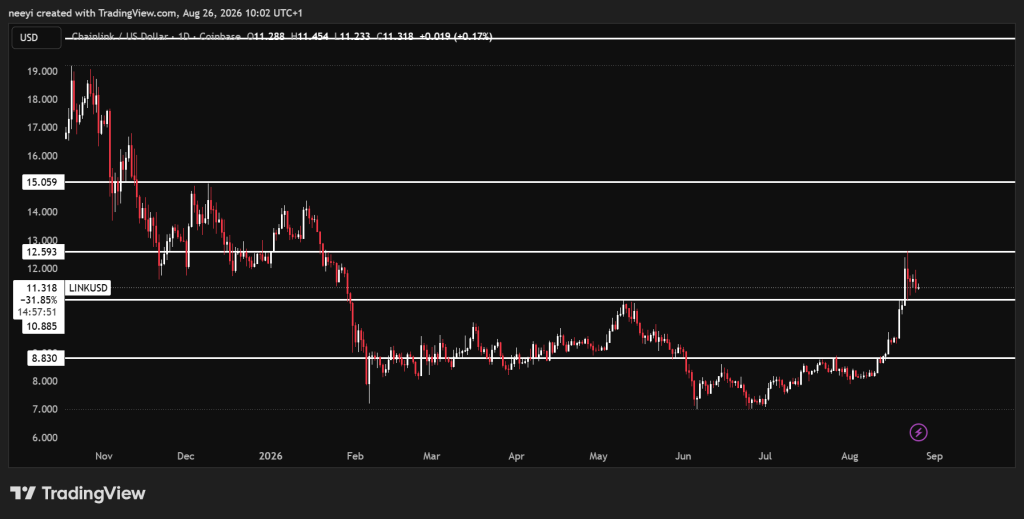
The $10.80 area is especially important on the downside. A convincing loss of this level could expose LINK to another decline toward $8.80 over the following days.
Buyers need a different result to improve the Chainlink price outlook.
LINK would first need to break above approximately $12.59. Such a move could open the path toward the next major area near $15.
The $15 region would then become another important test. A breakout above that level could leave room for LINK to target approximately $20 during the following days or weeks.
That gives the Chainlink price prediction several clear levels to monitor:
| LINK Price Level | Why It Matters |
|---|---|
| $8.80 | Lower target if $10.80 fails |
| $10.80 | Major support protecting the current range |
| $12.59 | Breakout level needed for a stronger recovery |
| $15 | Major resistance after a breakout |
| $20 | Higher target if LINK clears $15 with strong momentum |
A move toward $20 would still require LINK to complete several steps first. The token needs to defend $10.80, reclaim $12.59 and eventually overcome resistance around $15.
Failure at any of those stages could keep LINK inside its current range or return the price toward lower support.
Weekly LINK Indicators Show Improving Strength but MACD Remains Weak
Weekly technical indicators provide a mixed picture, although several readings lean toward improving price strength.
The Relative Strength Index, or RSI, currently reads 59.649. RSI measures the strength of recent price changes on a scale between 0 and 100. A reading near 60 shows that positive momentum has improved, but LINK remains below the commonly watched overbought region above 70.
The stochastic indicator reads 45.16. This places LINK around the middle portion of its range and does not show an extreme condition in either direction.
MACD presents the main weaker reading. The weekly MACD stands at negative 0.461, which means the indicator has not fully confirmed stronger bullish momentum.
Rate of Change provides a more positive reading at 18.741. ROC measures how quickly the price has changed compared with an earlier period, and the positive figure shows that LINK has made meaningful progress from its previous levels.
Bull/Bear Power stands at 4.376. A positive reading indicates that buyers currently have greater strength than sellers based on this indicator.
| Name | Value | Brief Interpretation |
|---|---|---|
| RSI (14) | 59.649 | Positive momentum without an overbought reading |
| STOCH (9,6) | 45.16 | Momentum remains around the middle of its range |
| MACD (12,26) | -0.461 | Trend confirmation remains weak |
| ROC | 18.741 | Price momentum has improved from earlier levels |
| Bull/Bear Power (13) | 4.376 | Buyers currently show greater relative strength |
Taken together, the weekly indicators show that LINK has some positive momentum, although the technical picture is not completely aligned. MACD remains the main indicator that needs improvement if the broader recovery is going to become more convincing.
Chainlink enters its next price battle with several fundamental developments working in its favor. Spot LINK ETFs have recorded 7 consecutive days of inflows, those products now hold roughly 1.99% of the token’s supply, and Metric has selected Chainlink Data Streams for markets involving tokenized real world assets.
Read Also: Bitcoin Price Warning: BTC Just Flashed a Major Cycle Signal, Here’s the Data
The LINK price has not broken free from its range, however. That leaves $10.80 and $12.59 as the immediate levels that could decide what comes next. Losing $10.80 could reopen the path toward $8.80, whereas a break above $12.59 would put $15 back into focus.
A successful move beyond $15 could eventually bring $20 into the discussion. LINK still has several technical barriers to clear before that scenario becomes realistic, which makes the next breakout from its current range worth watching closely.
FAQs
Subscribe to our YouTube channel for daily crypto updates, market insights, and expert analysis.