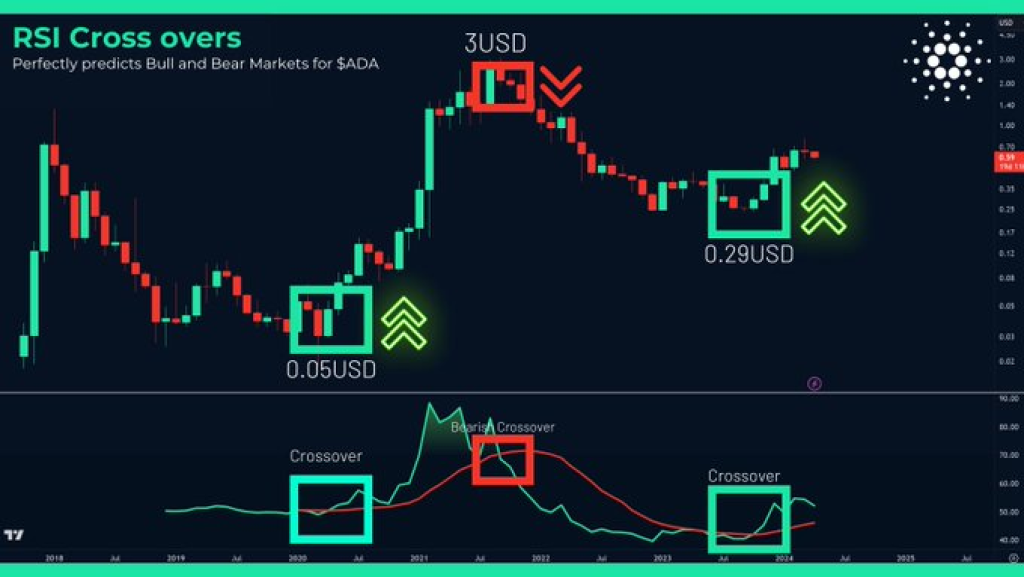
Cardano (ADA) is on the cusp of a significant bull run, as a rare event in its Relative Strength Index (RSI) has signaled a potential trend shift. The second RSI crossover in Cardano’s history has occurred, reminiscent of the previous instance when prices skyrocketed from $0.05 to $3. This thread shared by analyst Trend Rider is a must-read for Cardano holders, as it dives into how history is repeating itself and what it means for ADA’s future.

What you'll learn 👉
The First Crossover
The first RSI crossover happened right after the COVID-19 pandemic hit. This crossover was a perfect signal, as the price went parabolic immediately after, exploding once it crossed the parabolic line. This event marked the beginning of a significant bull run for Cardano.
The Bear Market
The RSI and its Simple Moving Average (SMA) crossovers have also proven to be reliable indicators of bear markets. The bearish crossover perfectly anticipated the previous bear market, providing strong validation for this indicator’s ability to predict Cardano’s long-term cycles.
Doge2014 raises 500K in days celebrating Dogecoin. Make potentially big profits and get in on exclusive airdrop!
Show more +The Second Crossover
The second RSI crossover occurred in October and November 2023. However, it is essential to note that there was a rejection a few months prior, which further validates the strength of this indicator. The occurrence of this second crossover suggests that Cardano is currently in a clear bull market phase.
- The RSI and its SMA crossovers are extremely reliable sources for identifying Cardano’s bull runs and bear markets in their early stages.
- According to the current RSI crossover, Cardano is undeniably in a bull market phase.
It should be noted that this analysis is based on a macro chart for holders, with each candle representing one month. As a result, investors should anticipate significant volatility within each candle.
While macro charts help in seeing the bigger picture, it is crucial to have a personal process in place to secure profits and protect oneself from any black swan events. Relying solely on macro indicators may not be sufficient for managing risk in the volatile cryptocurrency market.

The Significance of the RSI Crossover
The Relative Strength Index is a popular momentum oscillator that measures the speed and change of price movements. When the RSI crosses above its Simple Moving Average, it often indicates a bullish trend, while a crossover below the SMA suggests a bearish trend.
In Cardano’s case, the rarity of these crossovers makes them particularly significant. With only two occurrences in its history, the current RSI crossover is a strong signal that a major trend shift may be underway.
What This Means for Cardano Holders
For Cardano holders, the current RSI crossover presents a potentially lucrative opportunity. If history repeats itself, as it did during the first crossover, ADA prices could experience a parabolic rise. However, it is critical to approach this opportunity with caution and have a well-defined risk management strategy in place.
Investors should also keep in mind that the cryptocurrency market is highly unpredictable, and past performance does not guarantee future results. While the RSI crossover is a strong bullish signal, it is not the only factor influencing Cardano’s price movements.
Subscribe to our YouTube channel for daily crypto updates, market insights, and expert analysis.
We recommend eToro
Wide range of assets: cryptocurrencies alongside other investment products such as stocks and ETFs.
Copy trading: allows users to copy the trades of leading traders, for free.
User-friendly: eToro’s web-based platform and mobile app are user-friendly and easy to navigate.


