The price of Cardano has declined by around 11% since its April high, and things could get even worse. ADA is showing signs that this might not just be a short-term pullback.
The latest chart patterns hint at a deeper correction in the works, especially after the token failed to break above a key resistance level. Right now, ADA price is sitting uncomfortably close to a major breakdown zone.
What you'll learn 👉
ADA Price Rejected at Key Resistance, Downtrend May Continue
Cardano has been trading inside a well-defined descending channel since late 2024. This is a classic bearish pattern, and every time ADA has tried to break out, it’s been knocked back down. ADA was rejected again at the top of this channel, around the $0.73 mark, and this was also noted by Ali Charts in an X post. That’s the same level as the 0.786 Fibonacci retracement line, which often acts as strong resistance in a falling market.
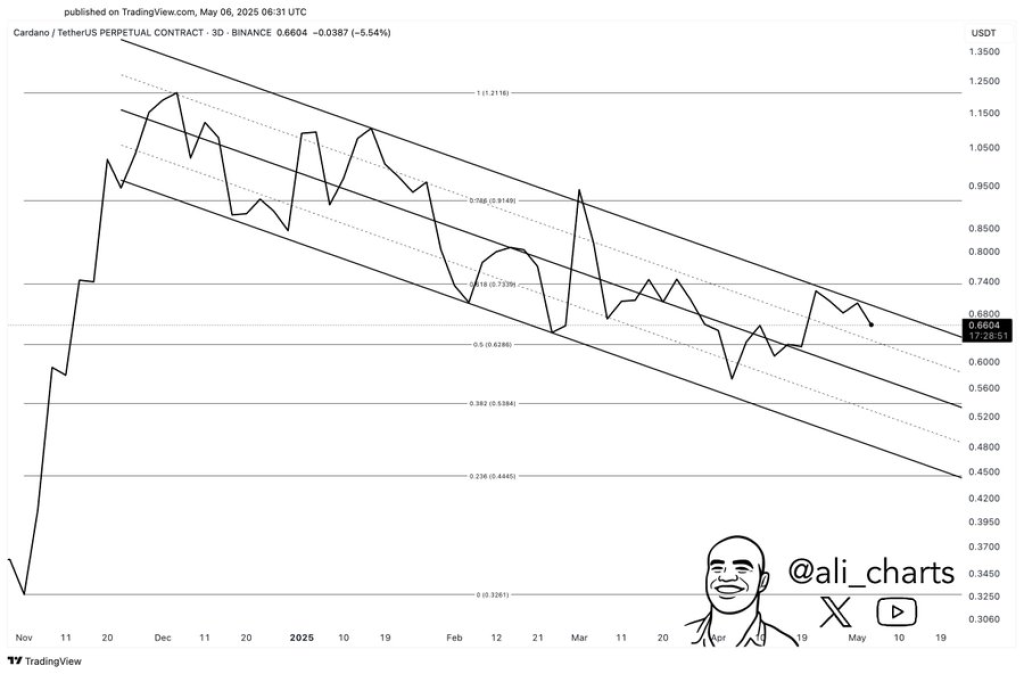
After this rejection, ADA quickly dropped back below the 0.618 Fibonacci level at $0.68 and is now hovering around $0.66. This type of price action is not unusual in a downtrend. According to the chart posted by analyst Ali Charts, Cardano is now likely headed toward the mid-range of the channel, which aligns with the 0.5 Fibonacci level at around $0.63. If that support fails to hold, the next stop could be down at $0.54, right near the 0.382 Fibonacci level.
The structure we’re seeing on the chart points to consistent lower highs and lower lows, a sign of bearish momentum. Since December 2024, the ADA price has tested the upper boundary of this channel several times but failed to hold any gains. Each rejection has led to a move lower, and this time doesn’t seem much different.
Cardano Price Outlook: Eyes on $0.63 and $0.54
Looking at the broader picture, the ADA price could be in for more pain if current levels give way. Ali Charts also pointed out that the $0.63 zone is more than just a Fibonacci level. It lines up with the channel’s midline, which has acted as a pivot point in the past. Losing that would signal a stronger move down to $0.54 or even lower.
Read Also: 3 Reasons Why Kaspa (KAS) Price Is Flat Following the Crescendo Update
Price rejection at resistance, failure to break above the channel, and steady downward pressure are all signals that bulls are struggling to regain control. If this trend continues, ADA could slide toward the lower edge of the channel, somewhere near the $0.44 or $0.38 zone. These levels match the 0.236 and 0.382 Fib retracement lines based on the full move from the $1.21 top to the $0.26 low.
At the moment, any hope for a bullish reversal would require ADA to break above the channel completely and flip $0.73 into solid support. That seems unlikely in the short term, especially given how Cardano is behaving on the charts shared by Ali.
So while the $0.63 level may offer temporary support, the bigger picture still favors the bears. Unless sentiment shifts or new fundamentals come into play, ADA could be on its way to retesting some painful lows.
Subscribe to our YouTube channel for daily crypto updates, market insights, and expert analysis.

We recommend eToro
Wide range of assets: cryptocurrencies alongside other investment products such as stocks and ETFs.
Copy trading: allows users to copy the trades of leading traders, for free.
User-friendly: eToro’s web-based platform and mobile app are user-friendly and easy to navigate.