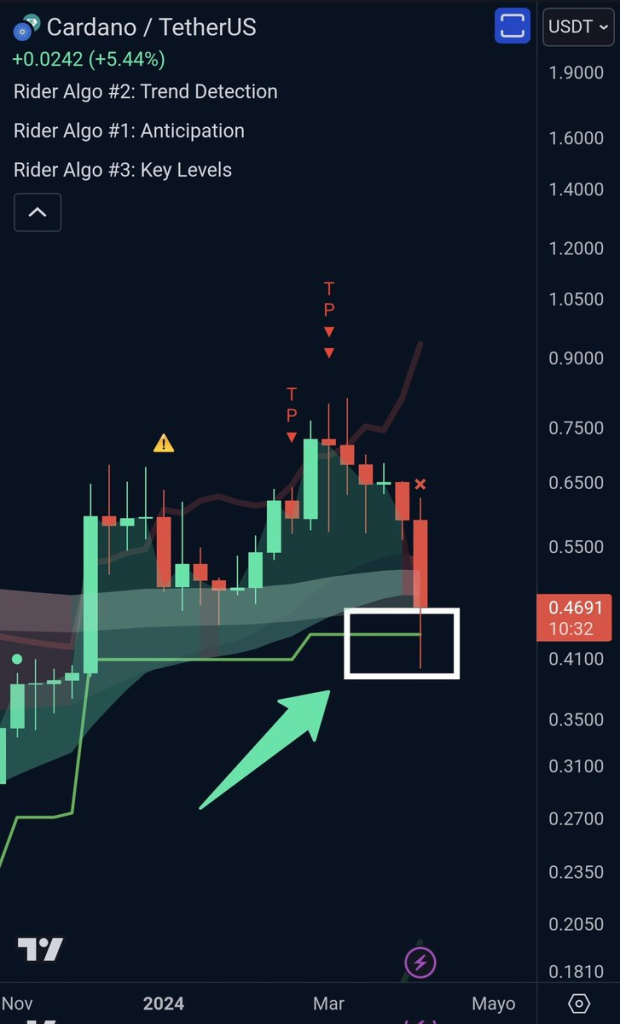
As the weekly candle closes, Cardano (ADA) has managed to defend its most critical support zone, providing a glimmer of hope for investors.
According to analyst Trend Rider, despite the presence of a red “x” above the candle, which is often considered a bearish signal, the cryptocurrency’s ability to hold its ground suggests that it may be poised for a potential rebound. Traders and analysts are now closely monitoring the weekly timeframe for bounce signals that could indicate a reversal in ADA’s recent downtrend.

What you'll learn 👉
Technical Analysis
A recent technical analysis by altFINS, conducted on April 13, provides valuable insights into the current state of Cardano’s price action and potential trading opportunities.
Trade Setup
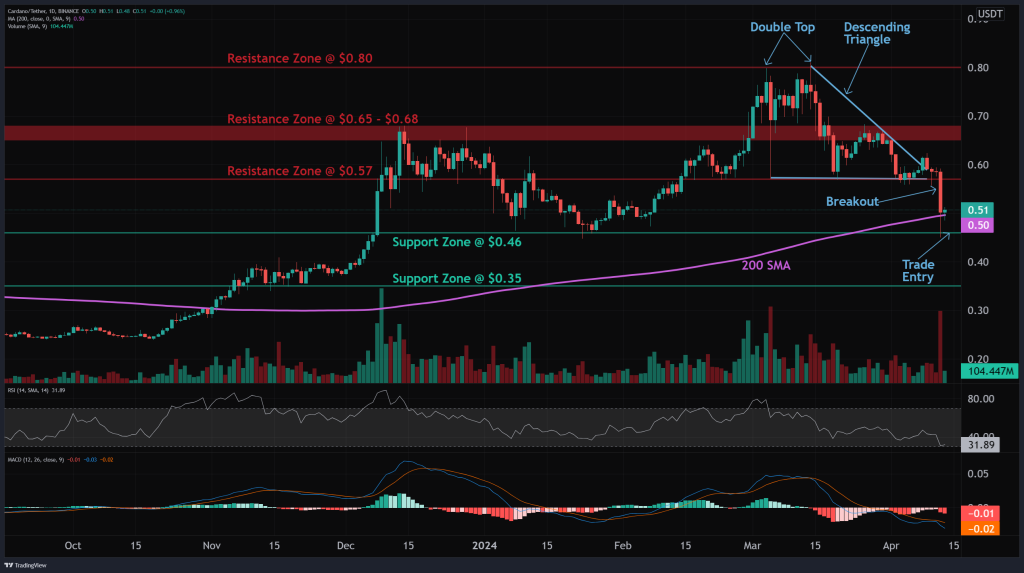
Cardano’s price trends are currently mixed, following a bearish breakout from a Descending Triangle pattern and a dip below the $0.57 support level. The cryptocurrency found support at the $0.46 horizontal level, which coincides with the 200-day moving average around $0.50.
This support zone could prove to be robust and present a potential swing trade entry for investors, with a possible 15-20% upside back to the $0.57 level. A stop-loss (SL) level has been set at $0.55, and traders are advised to set a price alert to monitor the situation closely.
Doge2014 raises 500K in days celebrating Dogecoin. Make potentially big profits and get in on exclusive airdrop!
Show more +Pattern and Trend
Cardano is currently trading within a Descending Triangle pattern, which typically indicates that a breakout will occur in the direction of the existing trend. The short-term and medium-term trends are currently in a downtrend, while the long-term trend remains in an uptrend.
The momentum indicators for Cardano are currently bearish, with the MACD (Moving Average Convergence Divergence) line trading below the MACD signal line and the RSI (Relative Strength Index) below 45.

Source: altFINS – Start using it today
Support and Resistance Levels
The nearest support zone for Cardano is located at $0.46, followed by $0.35. On the upside, the nearest resistance zone is situated at $0.57, which previously acted as a support level. If the price manages to break above this level, the next resistance zones can be found at $0.65 – $0.68 and $0.80.
As Cardano continues to defend its critical support zone, investors and traders are cautiously optimistic about the cryptocurrency’s prospects. While the presence of a red “x” above the weekly candle is a cause for concern, the fact that ADA has managed to hold above the crucial support levels suggests that it may have the resilience needed to stage a comeback.
Subscribe to our YouTube channel for daily crypto updates, market insights, and expert analysis.
We recommend eToro
Wide range of assets: cryptocurrencies alongside other investment products such as stocks and ETFs.
Copy trading: allows users to copy the trades of leading traders, for free.
User-friendly: eToro’s web-based platform and mobile app are user-friendly and easy to navigate.


