
The meme coin market has shown renewed interest in PEPE, as technical indicators reflect possible trend reversals. Prominent analyst James Wynn shared a chart on X that has drawn attention within the crypto community.
In his post, Wynn stated, “The most bullish $PEPE chart I have ever seen. Congrats to all those who survived the purge. Now we go higher.” His analysis accompanied a price chart that suggests a possible recovery for PEPE, a coin that has faced extended downward pressure in recent months.
What you'll learn 👉
PEPE Chart Patterns Indicate Potential Reversal
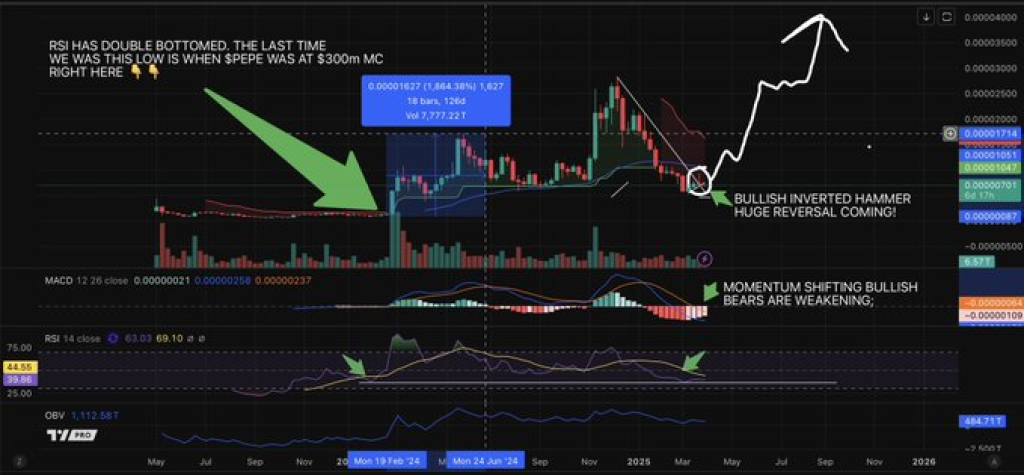
The shared chart displays a double bottom formation on the PEPE price chart, a pattern often linked to trend reversals in technical analysis. This pattern appears near a defined support level between 0.00000070 and 0.00000085. The price movement also includes a bullish inverted hammer candlestick, suggesting a shift in sentiment.
A projected path drawn on the chart suggests a breakout may follow. Resistance zones are marked at previous peaks around 0.00000230 and 0.00000300. These zones could act as price targets if the coin moves upward with sustained momentum. The structure on the chart points toward a shift in market behavior after a period of low volatility and price compression.
Read Also: Kaspa Price Prediction for This Month (April)
Indicators Suggest Momentum Shift for PEPE Price
Momentum indicators on the chart provide further context. The RSI shows a double bottom pattern and sits at 34.55. This level is close to the oversold threshold, which can indicate building buying pressure. The last time RSI dropped this low, PEPE was trading at a market capitalization near $300 million.
The MACD histogram shows that bearish momentum is starting to fade. The two MACD lines are getting closer, and if they cross, it could signal a shift in trend. Meanwhile, the OBV line has been pretty flat, but it’s starting to tilt upward, a sign that buyers might be stepping in.
Furthermore, volume activity on the chart shows that the strongest trading days occurred during a prior uptrend. Current volume remains low but steady. Low volume near a support level is often viewed as a base-building phase. If accumulation continues, a volume breakout may confirm the technical signals.
The post by James Wynn connects these chart signals with market sentiment. His use of the term “purge” references the earlier sell-off period, implying that the chart represents a new phase in PEPE’s price cycle. The optimism expressed in the tweet has increased visibility around the asset.
PEPE Technical Setups and Market Watch
Technical patterns, when aligned with consistent volume and momentum indicators, can provide early signals for price movement. Traders observing PEPE may watch closely for confirmation through volume increases and MACD crossovers. RSI movement above the 50 level may also reinforce the bullish scenario suggested by the chart.
While market conditions remain uncertain across many digital assets, chart-based analysis continues to guide trading behavior. As PEPE price gains renewed attention through technical discussions, further confirmation through trading activity will determine the sustainability of the current setup.
Subscribe to our YouTube channel for daily crypto updates, market insights, and expert analysis.

We recommend eToro
Wide range of assets: cryptocurrencies alongside other investment products such as stocks and ETFs.
Copy trading: allows users to copy the trades of leading traders, for free.
User-friendly: eToro’s web-based platform and mobile app are user-friendly and easy to navigate.