The price of Cardano’s ADA token has seen some interesting moves lately that could signal the start of a new bullish cycle according to technical analysis. After bottoming out around $0.17 in June 2022, ADA saw a bounce and has traded roughly between $0.20 and $0.30 for the past few months. Now some key indicators are pointing to a potential breakout to the upside.
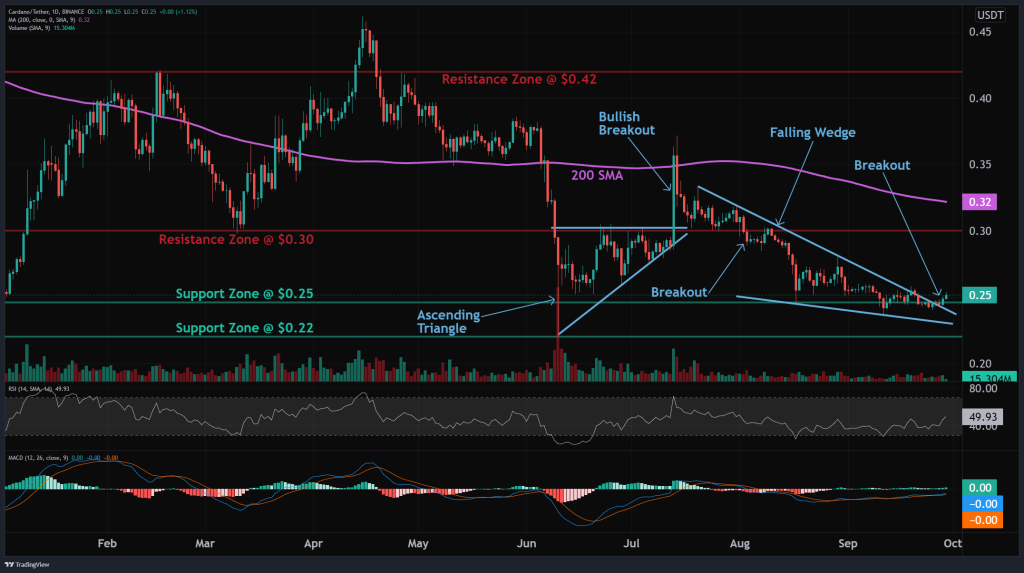
Examining the hourly chart, a falling wedge pattern has emerged since mid-September, with ADA in an overall downtrend but beginning to make higher lows and lower highs. This signals that sellers may be losing steam, and buyers are starting to absorb the excess supply in the market.
Often falling wedges lead to bullish breakouts, so traders will be watching closely to see if ADA can break above the upper trendline around the $0.28 level. A move above this Resistance would open up upside towards the psychological $0.30 area which also lines up with horizontal resistance from August, according to altFINS.

Source: altFINS – Start using it today
The momentum indicators are painting a mixed picture currently. The MACD line is above the signal line which is bullish, but the RSI is hovering right around 50 which is neutral. A decisive move above 50 on the RSI would add confidence to the bullish falling wedge breakout thesis. If ADA stalls here, there is potential for a retest of the recent swing low around $0.21 before attempting another move upwards.
When looking at Fibonacci retracement levels from the major high of around $0.42 in October last year, the zones around $0.27 to $0.28 align with the 61.8% retracement. This adds confluence to that area being a key level of resistance for bulls to overcome.
On the downside, the $0.25 level remains important support that has held up multiple times in 2022. Below that, the must hold support sits around $0.21 to $0.22 where ADA found buyers to bounce in June and September. Losing $0.22 would likely signal a deeper pullback is ahead.
To summarize, ADA appears to be setting up for a potential bullish falling wedge breakout above $0.28 resistance. A daily close above $0.30 would confirm the breakout and upside continuation towards $0.42 is on the table. However the mixed momentum picture means a drop to retest the $0.21 swing low is still a possibility if $0.25 support fails to hold. Active traders can look to play the range between $0.25 and $0.28 while waiting for a definitive chart pattern breakout. The next few weeks will be key for determining if in fact a new ADA bull cycle is kicking off.
We recommend eToro
Wide range of assets: cryptocurrencies alongside other investment products such as stocks and ETFs.
Copy trading: allows users to copy the trades of leading traders, for free.
User-friendly: eToro’s web-based platform and mobile app are user-friendly and easy to navigate.


