
Bitcoin is under pressure again today after failing twice to clear the $87,000 area over the past few weeks.
That gives CryptoCon, one of the analysts who has remained skeptical that a new Bitcoin bull market has fully begun, another reason to revisit his bearish cycle thesis.
His latest argument comes from Global M2 Strength, a liquidity-based indicator that has historically lined up surprisingly well with major Bitcoin cycle transitions.
CryptoCon says the signal still does not show the kind of reset normally associated with a true cycle bottom.
What you'll learn 👉
CryptoCon Says Global Liquidity Has Not Reset Yet
CryptoCon’s chart divides global liquidity conditions into three phases.
Phase 1 marks the end of a bear market and the beginning of a fresh liquidity injection.
Phase 2 represents the mid-cycle push.
Phase 3 marks the final liquidity expansion that tends to accompany the parabolic part of a Bitcoin cycle.
His concern is that the current Global M2 Strength reading has not completed the sequence needed to start a new Phase 1.
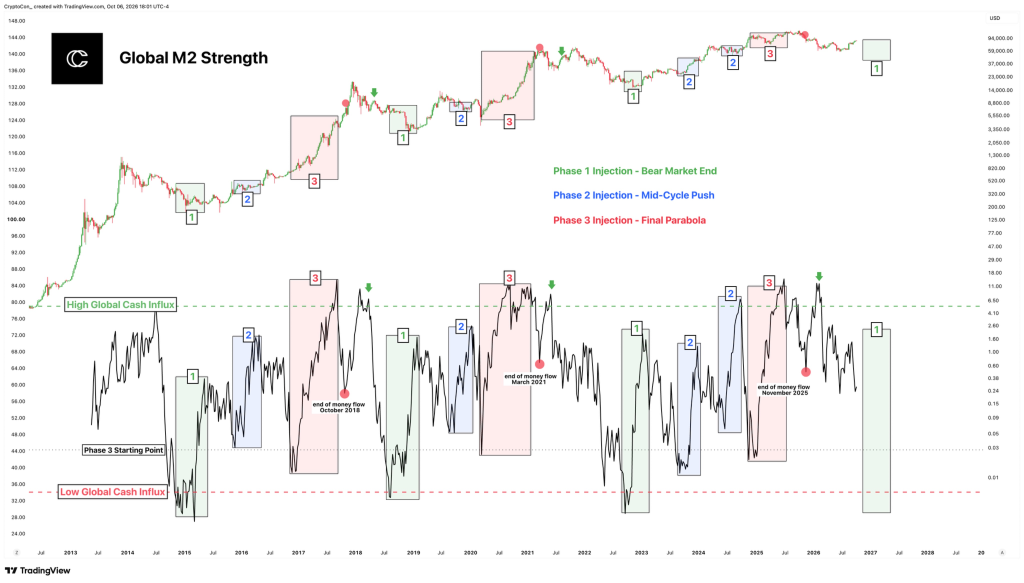
Historically, the indicator first falls beneath what he labels the Low Global Cash Influx line before turning strongly higher.
That deep reset appeared around previous major Bitcoin bottoms.
CryptoCon does not see it yet.
The Chart Has Tracked Previous Bitcoin Cycles Closely
The lower section of the chart is the most important part.
CryptoCon marks several liquidity injections across previous cycles and compares them with Bitcoin price action above.
The green Phase 1 zones appeared near major bear-market endings.
The blue Phase 2 zones followed during the middle portion of the expansion.
Then came the red Phase 3 zones near the final stages of the cycle.
One detail CryptoCon considers especially important is how accurately the indicator identified the end of previous money-flow phases.
The red dots on the chart mark the end of liquidity flows around October 2018, March 2021 and November 2025.
Those points lined up closely with significant changes in Bitcoin’s broader cycle structure.
That historical consistency is why he is reluctant to dismiss the current reading.
What Would Signal a Real Bitcoin Cycle Bottom?
For CryptoCon, the indicator still needs two things.
First, Global M2 Strength would need to fall beneath the Low Global Cash Influx threshold near the bottom of the chart.
Then it would need to reverse and surge strongly higher.
That sequence would resemble previous Phase 1 liquidity injections and give him much more confidence that a new Bitcoin cycle has begun.
His chart currently projects that potential window into 2027.
That does not mean Bitcoin must fall continuously until then. It means the liquidity signal he watches has not yet delivered its traditional confirmation.
Read also: “Sunday Pump = Monday Dump”: Analyst Warns Bitcoin Could Pull Back Next
Bitcoin’s Repeated $87K Rejections Add to the Doubt
The timing of CryptoCon’s post is notable.
Bitcoin has tested the $87,000 region twice in recent weeks but failed to establish a sustained move above it.
Price has since moved lower again alongside weakness across the broader crypto market.
A rejection by itself does not prove the bull-market thesis is wrong.
But combined with incomplete cycle indicators, it gives CryptoCon more evidence for his argument that the recent recovery could still be occurring before the final macro reset.
That is the key distinction in his thesis.
He is not arguing that Bitcoin can never move higher.
He is questioning whether the market has already completed the process normally seen before a durable new bull cycle.
Why Global M2 Is Different From a Typical Bitcoin Indicator
CryptoCon also likes this signal because it comes from outside Bitcoin itself.
Indicators such as RSI, realized price, SOPR or other on-chain metrics are directly tied to BTC price and investor behavior.
Global M2 attempts to measure the broader amount of money available across major economies.
That gives it a different perspective.
More global liquidity can eventually flow toward risk assets such as stocks and crypto. Less liquidity can make those markets harder to sustain.
This is why CryptoCon sees the indicator as another independent check on his cycle thesis.
For more crypto news and price predictions, click here.
Subscribe to our YouTube channel for daily crypto updates, market insights, and expert analysis.