
It looks like Bitcoin is starting the next day of trading from an unusually awkward position. The BTC price now stands at about $63,000, having been sold off once again by U.S. investors from about $63,800 down to $62,900.
What makes this setup interesting is that the same pattern has appeared for four sessions in a row. Bitcoin has been able to recover during the hours outside the U.S. session, only to face fresh selling once American trading gets underway.
At the same time, Bitcoin’s wider ecosystem is dealing with a separate issue. The Bitcoin Red Team has used frontier AI to scan almost the entire open-source ecosystem and has reported multiple critical and high-severity vulnerabilities.
What you'll learn 👉
BTC Price Action – Structure by Phase
However, when one examines the Bitcoin chart in more detail, the recent trend becomes quite clear. The 4-hour chart is dated June 1 through August 13, illustrating how the BTC price started falling from a significant June low, then recovered strongly in mid-July, and then gave up some of the gains made since then.
The first important move happened late in June when the Bitcoin price fell to $57,758, which was the lowest point on the chart and acted as the base for subsequent recovery moves. BTC climbed sharply from there to reach $67,255 in mid-July.
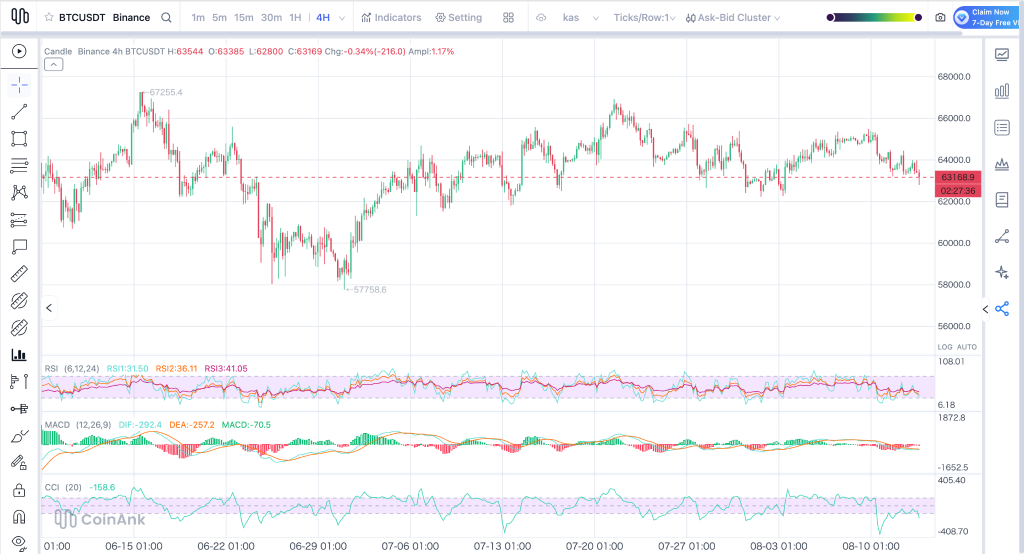
This was an excellent rebound, but buyers were unable to maintain the price at this level. Following its climb to the local top, the cryptocurrency began forming a chain of lower highs, which indicated that the upward movement was weakening.
Following that, BTC continued to move sideways and even downwards. This latest development is even more troubling as the cryptocurrency has dipped below the $63,500 structural support level to trade at $63,169, representing a loss of 0.34% during the day. This means BTC is currently trading below a support level that had earlier acted as the bottom in the 4-hour chart.
Current move: The cryptocurrency is trading at $63,169 after dipping below the $63,500 support level. Next on my watch list is the $60,000-$62,000 area that is part of the broader support area created during the June pullback.
Support & Resistance Zones:
| Level | Type | Notes |
| $67,255 | Major resistance | Mid-July local high |
| $63,500 | Broken Support/Resistance | Previous structural floor now lost |
| $63,000-$63,500 | Pivot Zone | Immediate area BTC needs to reclaim |
| $62,000 | Support | First major downside level |
| $60,000-$62,000 | Major support | Broader June support zone |
| $57,758 | Major support | June swing low |
The level traders are watching right now is $63,500. Bitcoin has already slipped below it, so getting back above this level would give buyers some room to recover. If BTC stays below $63,500, the next major test is around $62,000.
Indicators:
RSI (6, 12, 24): The short term RSI1 is at 31.50, the medium RSI2 is at 36.11, and the long term RSI3 is at 41.05. The fast RSI is near to the traditional oversold level of 30, indicating the extent to which the selling pressure has affected BTC. The remaining two readings also remain low, maintaining momentum towards the bear side.
MACD (12, 26, 9): DIF stands at -292.4 while DEA stands at -257.2. The histogram remains heavily on the negative side, indicating that sellers remain in control of the ongoing movement. There is also no sign of any bullish crossover here.
CCI (20): CCI is at -158.6, lower than the oversold level of -100. The CCI is thus in the oversold region, in accordance with the strong selling pressure seen in the price of Bitcoin.
Looking at the bigger picture, Bitcoin climbed from the $57,758 June low to $67,255 in mid-July before the recovery started losing steam. BTC then formed a series of lower highs and has now broken below the $63,500 support level.
From here, there are two main possibilities. The BTC price may be able to find buyers at $62,000-$62,500, resulting in a relief rally towards $63,500. Reclaiming the support level would allow buyers to take a crack at getting above $64,000 again.
The other possibility is that sellers keep control and BTC breaks below $62,000. That would bring the broader $60,000-$62,000 support zone into play, with the $57,758 June low becoming the next major downside level.
For me, $63,500 remains the key level. Bitcoin needs to reclaim it to repair the recent breakdown. If BTC stays below it and then loses $62,000, the path toward the June low becomes much more open.
Read Also: Why Is the Crypto Market Crashing as Bitcoin Price Falls Below $63K?
Bitcoin Security Gets an AI Reality Check
The price action is only part of the Bitcoin story right now. BitcoinNews reported that a Bitcoin Red Team member CalleBTC said the team spent about two weeks using frontier AI to scan almost the entire Bitcoin open-source ecosystem for vulnerabilities.
BITCOIN RED TEAM: “EVERYTHING IS BROKEN”
— Bitcoin News (@BitcoinNewsCom) August 13, 2026
After two weeks using frontier AI to scan virtually the entire Bitcoin open-source ecosystem for vulnerabilities, Bitcoin Red Team member @callebtc says the “low hanging fruit is done,” with maintainers validating “a ton” of critical and… https://t.co/Lexm9xjiMf
The team reported numerous critical and high-severity findings, with maintainers validating many of them. Lightning Network projects received particular attention because of their complexity. CalleBTC also warned that Bitcoin-related projects that are no longer actively maintained should be treated as potentially vulnerable until they receive proper security testing.
The larger problem is the rate at which AI could analyze the code. While human researchers take some time to comb through these repositories, AI can analyze large volumes of code very quickly. This doesn’t mean that Bitcoin is flawed by itself. These discoveries apply to other open-source projects. In fact, the Red Team views the process as a way to identify weaknesses and make the ecosystem stronger.
Bitcoin Price Forecast for Today
The Bitcoin price is now testing the $63,000 area after four consecutive U.S.-session sell-offs.
Bullish Case: If BTC reclaims $64,000 and holds above it during U.S. trading hours, the recent selling pattern starts to lose credibility. That could put $64,800-$65,000 back in play.
Neutral Scenario: Bitcoin could continue moving between $63,000 and $64,000, giving buyers and sellers time to establish a clearer direction.
Bearish Scenario: A sustained break below $63,000 would put $62,000-$62,900 into focus. Losing that area would open the door toward the broader $60,000-$62,000 support zone.
My Take: I’m watching $63,000 and $64,000 more than anything else right now. The repeated U.S.-session selling is clear in the 1-hour data, but calling it manipulation would require more evidence from order-flow and institutional data. If BTC gets back above $64,000, the short-term setup improves. If $63,000 gives way, the Bitcoin price could have more room to fall.
FAQs
Subscribe to our YouTube channel for daily crypto updates, market insights, and expert analysis.