
The geopolitical shock that defined Bitcoin’s first half of 2026 may finally be unwinding. President Trump confirmed that Iran’s Supreme Leader has approved a comprehensive deal, with a formal signing expected as early as this weekend. The US naval blockade lifts on signing. The Strait of Hormuz reopens. The Kharg Island military operation is off the table.
Oil markets moved instantly. Crude slid from $92 to $88 on the announcement alone. BTC caught a bid, bouncing over 3% intraday from its $61,100 floor to reclaim $63,000 levels.
But where does Bitcoin go from here? Here’s what the data, the macro backdrop, and the 2026 price structure say.
What you'll learn 👉
How the US-Iran Conflict Drove BTC in 2026
To understand where price is headed, you need to understand what drove it down in the first place.
The conflict became Bitcoin’s primary volatility engine for six straight months. Every escalation triggered forced deleveraging and liquidation cascades. Every peace milestone sparked swift recoveries. BTC stopped trading like a store of value and started trading like a high-beta macro sentiment gauge reacting to geopolitical headlines in real time.
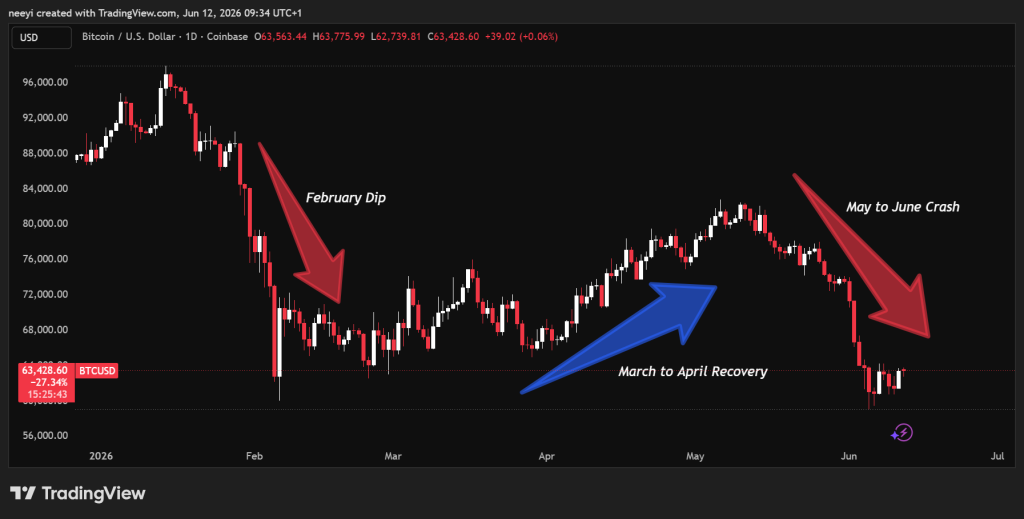
BTC peaked at around $97,000 in January on the back of record spot ETF inflows. Then direct US-Israel-Iran conflict erupted. The Strait of Hormuz closed. Leveraged traders were caught overexposed, and a cascading liquidation wave wiped BTC from $97K down to a cycle floor of $59,900 by early February.
Then Trump announced “productive conversations” with Iranian leadership. BTC started to recover again as the military ceasefire also started to extend to allow diplomats to build a permanent framework. Global confidence surged, and Bitcoin touched $82,000 in early May.
Soon after, progress stalled and localized military strikes resumed; combined with institutional spot ETF outflows, BTC fell over 25%, bottoming near $59,000.
This week, Trump canceled planned military strikes after Iran’s Supreme Leader formally approved the comprehensive nuclear and sanctions package, and in the past 24 hours BTC has popped back above $63,000.
| Period | Event | BTC Move |
|---|---|---|
| February | Conflict outbreak & Strait of Hormuz closure | $77K → $59K |
| March | Trump announces “productive conversations” | $63K → $71K |
| April | Formal ceasefire extension announced | Rally to $82K |
| June 6 till date | Peace Progress Stalled | Dip to $59K |
| June 6 till dat3 | Potential peace deal announcement | Bounce to $63K |
What the Deal Actually Means for Bitcoin and BTC Price Outlook
This is where most takes get it wrong. A peace deal is not straightforwardly bullish for BTC, at least not immediately.
The crisis premium disappears the moment the deal is signed. Bitcoin occasionally catches a safe-haven bid during acute geopolitical stress and that tailwind is now gone.
As Hormuz disruption fears fade, investors rotate back into traditional risk assets including equities, credit, and growth plays. The immediate effect is price consolidation or a mild pullback. Not a collapse, but not a clean breakout either.
The sustained impact is a different story entirely. Falling energy prices reduce operational costs for mining facilities globally.
Lower electricity bills mean miners face less pressure to liquidate newly minted BTC to cover expenses, which is a direct reduction in natural sell-side pressure on the market. People also get to take more risks which could put more funds into Bitcoin and take it higher again.
Read Also: Is It All Over for Solana? What a Bitcoin Crash to $40K Would Mean
Bitcoin Price Prediction Scenarios Following US‑Iran Deal
Three scenarios emerge from here depending on how the deal signing plays out.
Scenario 1: Deal Signs This Weekend: Controlled Rally
If the formal Strait of Hormuz reopening deal is signed by Saturday or Monday as Trump has suggested, the immediate price response will likely be a continuation of the current relief bounce rather than a violent spike. Markets have partially priced the deal in already, given Trump’s public confirmation and the tone of current headlines.
Expect BTC to test the $66,000 to $68,000 range in the days following signing as short sellers continue to cover and risk sentiment improves broadly. That is the first structural resistance zone from the early June breakdown.
Sustained buying into the following week, particularly if spot ETF inflows respond to the improving macro backdrop, could push price toward the $71,000 to $74,000 zone. That is the range BTC held before the final capitulation in early June and represents the next logical target for a recovering market.
Scenario 2: Deal Delays or Partial Agreemen: Back to Consolidation
Trump declined to set a deadline, which leaves room for the signing to slip into next week or beyond. If implementation details stall around Hormuz reopening timelines or sanctions verification, markets will interpret that as diplomatic friction. The crisis premium does not fully evaporate but neither does the uncertainty.
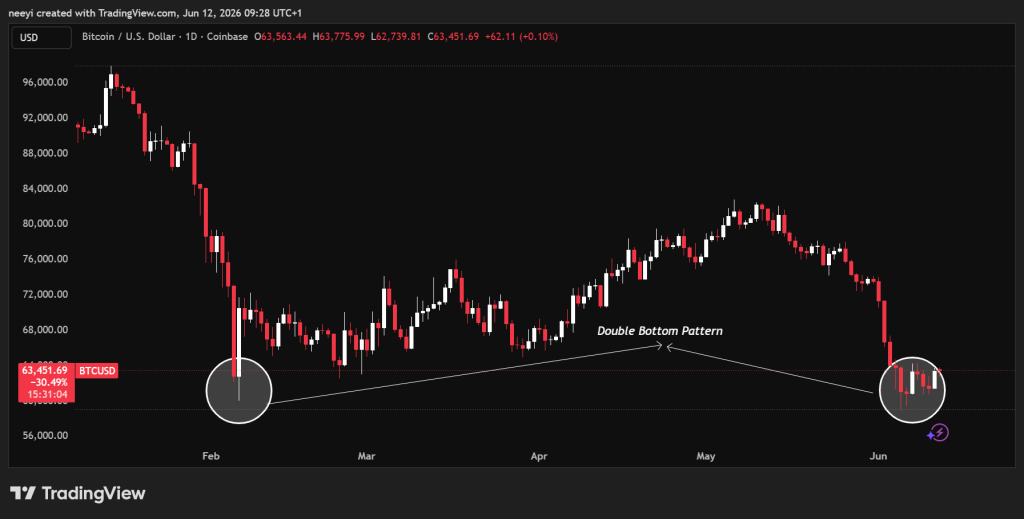
In this case, BTC is likely to continue to trade around the $61,000 to $63,000 range and consolidate at the double-bottom zone while traders wait for confirmation. No capitulation, but no sustained rally either. Sideways price action with elevated volatility around every headline.
Scenario 3: Deal Collapses or Military Action Resumes: Retest of Lows
Trump has canceled strikes before only to face renewed pressure for military response. If the deal collapses before signing or if a new provocation triggers US retaliation, the risk-off response will be immediate and sharp.
The $59,100 to $59,500 double-bottom support becomes the critical line. A confirmed break below $59,000 on deal-collapse news would signal structural breakdown and open a path toward the $52,000 to $55,000 range as leveraged longs get wiped again in a liquidation cascade similar to what played out in February.
| Scenario | Trigger | Near-Term Target | Extended Target |
|---|---|---|---|
| Deal signs this weekend | Formal signing Sat/Mon as expected | $66,000 – $68,000 | $71,000 – $74,000 |
| Deal delays or partial agreement | Signing slips, details stall | $61,000 – $63,000 consolidation | Sideways until confirmation |
| Deal collapses or military action resumes | New provocation, agreement falls apart | Retest $59,100 – $59,500 | $52,000 – $55,000 on breakdown |
Everything hinges on $59,100. That double bottom has held through multiple stress events in 2026. As long as BTC holds above it, the macro structure remains constructive and the peace deal rally has room to develop.
Read Also: Grok AI Predicts ONDO Price If Bitcoin (BTC) Crashes to $40k
The signing of this deal, particularly the Strait of Hormuz reopening, removes the single biggest macro overhang that has suppressed BTC since February. What follows is not an immediate vertical move, but the beginning of a fundamentally different environment. Lower energy costs, easing inflation, room for rate cuts, and reduced forced selling from miners add up to a structurally better market than the one BTC has been navigating for the past four months.
FAQs
Subscribe to our YouTube channel for daily crypto updates, market insights, and expert analysis.