Bitcoin Price News: Everyone Is Watching ETF Outflows, but Smart Money May Be Seeing Something Else

Bitcoin is trading around $63,883, up 0.76% over the last 24 hours, but the small daily gain doesn’t capture everything happening beneath the surface. ETF investors are pulling billions from the market, geopolitical news is lifting risk assets, companies are still buying BTC, and on-chain data points to a market that refuses to panic. That’s why the BTC price has become much more interesting than the chart alone indicates.
What you'll learn 👉
Bitcoin Gets Help from Improving Market Sentiment
The recent rise in Bitcoin’s price was due to the ease in tensions between Iran and the United States, causing an uptick in risk appetite overall. The S&P 500 rose by 1.75%, oil prices declined, and Bitcoin rose from around $61,100 to over $63,400.
The move wasn’t isolated to traditional markets. Inside crypto, investors also rotated toward larger assets. Bitcoin dominance climbed to 58.6%, and the Altcoin Season Index dropped 8.16%, showing that many traders preferred BTC over smaller cryptocurrencies. That macro backdrop has given the BTC price some breathing room, but bigger forces are still in play.
One of the biggest challenges for the BTC price remains spot Bitcoin ETFs. The products have recorded roughly $2.1 billion in net outflows during June, after losing another $2.4 billion in May. ETF assets have fallen from about $109 billion to $77 billion since mid-May, mirroring Bitcoin’s decline from around $81,000 to below $60,000.
The selling doesn’t necessarily mean investors have lost confidence in Bitcoin. Part of the outflows comes from arbitrage funds closing trades, and some capital has moved into AI and technology stocks. Even so, billions leaving ETFs still create selling pressure that the market has to absorb.
Smart Money Doesn’t Seem To Be Waiting
Despite the ETF withdrawals, corporate buyers continue accumulating Bitcoin. Bitcoin Corporation America, which is a subsidiary of Hut 8, added 623 BTC in seven days bringing its holding to 4,941 BTC. 542 BTC were acquired from the open market while the rest came from mining.
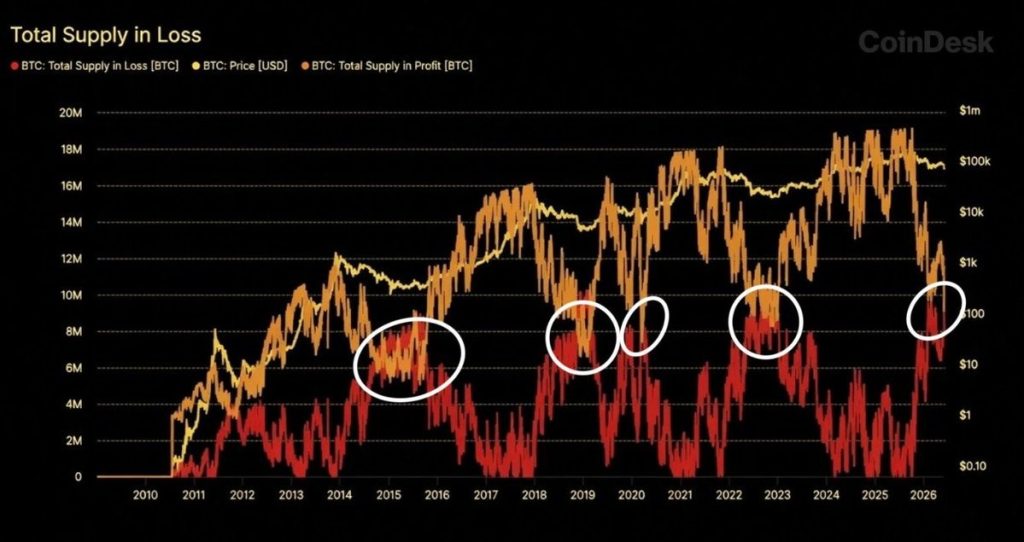
Whale Factor also pointed to an interesting pattern. Its on-chain chart shows that most Bitcoin holders remain in profit despite months of weakness. Previous market bottoms often formed after retail investors lost interest and the price spent long periods moving sideways.
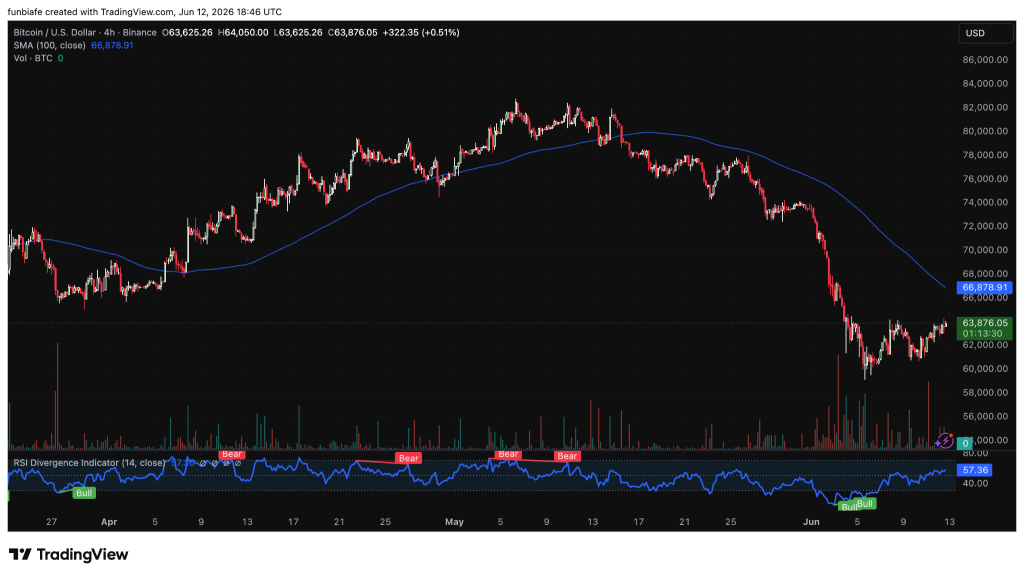
We had a look at the BTC chart, and the technical picture matches that idea. Bitcoin trades near $63,876, about 4.5% below the SMA 100 at $66,879, so the broader trend still favors sellers. Meanwhile, several bullish divergences have emerged over the last month through the RSI indicator while its reading stands at 57.36, signaling reduced bearish strength despite prices failing to overcome key resistance levels.
Bitcoin is also prepared for the future. One proposal discussed in April explored quantum-resistant transaction methods that could protect the network from future advances in quantum computing. Early estimates put the computational cost between $75 and $150 per transaction, showing that developers are already evaluating solutions for risks that may still be years away.
How the SpaceX IPO Drained Liquidity from Bitcoin
The SpaceX IPO didn’t directly cause a big price drop in Bitcoin, but it contributed to a notable shift in market liquidity and sentiment. The IPO absorbed massive amounts of capital, with some analysts suggesting that it, along with OpenAI and Anthropic offerings, may have pulled “trillions” of dollars in liquidity from other markets, including crypto.
As investors moved funds to participate in the highly anticipated IPO, trading volume in spot and derivatives markets thinned, making Bitcoin more vulnerable to price swings. This liquidity drain, combined with broader market fears over government selling and the ongoing interest rate uncertainty, has been a factor in Bitcoin’s recent struggle to maintain key support levels above $60,000.
The excitement around “SpaceX token mania” also drew attention away from Bitcoin and toward speculative tokenized pre-IPO markets on networks like Solana, which contributed to the bearish sentiment for major cryptocurrencies like BTC during the early summer of 2026.
Where Could The BTC Price Go Next
The BTC price is caught between strong accumulation trends and persistent selling pressure from ETFs. Bitcoin continues to be acquired by institutional purchasers, worries about geopolitics have subsided, and divergence in the RSI is pointing out that bearish pressure might have dissipated.
That being said, Bitcoin is still trading beneath the declining SMA 100, hence leaving the technical framework under negative pressure. The $63,000 mark still holds the importance of being the significant support level.
Should buyers keep holding this ground, Bitcoin price can test $66,879, heading towards $70,000. If support fails, attention will quickly turn to $60,000, especially with the Federal Reserve meeting and ETF flow data likely to influence the market’s next move.
FAQs
Subscribe to our YouTube channel for daily crypto updates, market insights, and expert analysis.