
Bitcoin price had a solid week. BTC pumped 3.5% from its lows and is now trading around $62,500 at press time. The token bounced from the recent low near $58,000 and has been grinding higher.
We enter the weekend now. Summer weekends usually bring lower trading volumes. But Ali Martinez posted something very interesting about Bitcoin price last night.
What you'll learn 👉
Ali Martinez: 3 Bullish Signals on the 12-Hour Chart
Ali Martinez, a widely followed crypto analyst, tweeted that Bitcoin’s 12-hour chart is showing a convergence of buy signals across key indicators.
The three signals:
- Tom DeMark Sequential: The indicator has printed a buy signal. This pattern historically anticipates a one-to-four candlestick relief rebound on higher timeframes.
- RSI Bullish Divergence: The RSI is forming a bullish divergence against the underlying price action. Price is making lower lows, but the RSI is making higher lows. That is a classic reversal signal.
- SuperTrend Flip: The SuperTrend indicator has flipped bullish, signaling a potential trend change.
Martinez noted that if these combined indicators receive validation through sustained spot volume, the immediate target for Bitcoin is at $65,400 – aligning with the TD setup resistance trendline.
Bitcoin Chart Analysis: Divergence and Key Levels
The attached 12-hour chart from Ali Martinez shows Bitcoin’s price action from early July 2026.
Key observations:
- BTC Price action: Bitcoin is trading at $62,362 on the chart. The price has been in a downtrend since mid-June, making lower highs and lower lows. The recent bounce from the $58,000 area is the first sign of a potential reversal.
- RSI divergence: The RSI at the bottom of the chart shows a clear bullish divergence. Price made a lower low near $58,000, but the RSI made a higher low. That is a classic signal that selling momentum is fading.
- The downtrend line: The chart shows a descending resistance line that has capped price since mid-June. A pump above this trendline would confirm the reversal.
- Key levels: The chart shows $65,000 as the first major resistance. Above that, $67,000 is the next level. Support is at $60,000 and then $58,000.
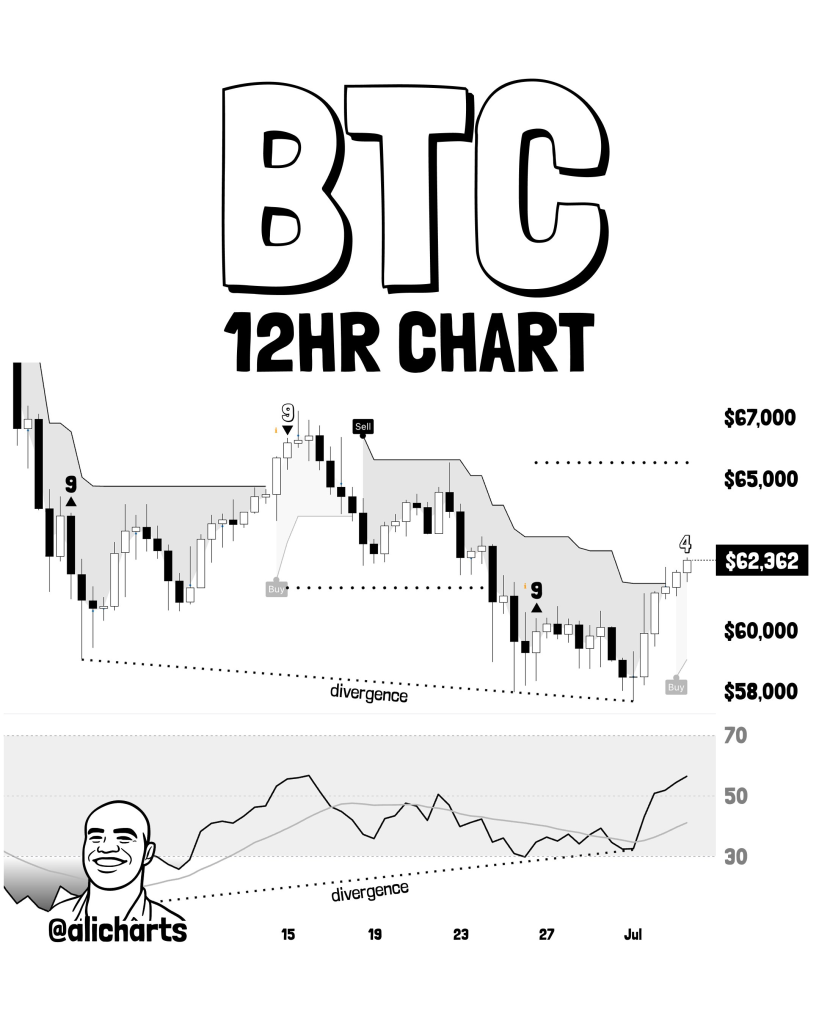
But, what the chart actually tells us? The divergence is real. The RSI is signaling that sellers are exhausted. But confirmation requires a break above the descending trendline and sustained volume.
Bitcoin ETF Flows: Institutions Rotating, Not Exiting
Spot Bitcoin ETFs experienced a record $4.5 billion in net outflows in June 2026, including ten consecutive days of withdrawals. That is the worst month since these funds launched.
But there is a nuance. Concurrently, newly launched U.S. spot ETFs for Hyperliquid posted eight straight weeks of inflows, totaling $161 million in June. This means a rotation of active institutional capital within crypto, not just an exit to cash.
The institutions are not leaving crypto. They are moving from Bitcoin to other assets. That is a less bearish signal than the headline outflow numbers indicate.
Read also: We Asked ChatGPT Which Crypto Could Outperform Bitcoin by 2027
Bitcoin Options Market: Cautious, Not Panicking
As we reported in our Bitcoin price news article last night, the options market is sending a more cautious message. When Bitcoin briefly traded below $60,000, traders rushed into protective put options. Reports estimate downside hedging reached roughly $1.2 billion around strikes between $55,000 and $60,000.
The broader options market remains defensive as well. Bitcoin options open interest sits near $34 billion ahead of major quarterly expiries worth approximately $9.3 billion in notional value. Puts continue trading at more than a 10% premium over calls, and weekly options skew remains heavily tilted toward downside protection.
This tells us that traders are hedging against further downside. That does not mean the market is crashing – it means the market is cautious. Cautious markets can turn quickly when the fear subsides.
Where Could Bitcoin Price Go Next?
Ali Martinez’s signals are worth paying attention to. The Tom DeMark buy signal, the RSI divergence, and the SuperTrend flip are three independent indicators pointing in the same direction.
The immediate target is $65,400. That aligns with the descending trendline on the 12-hour chart. A break above that level would confirm the reversal and open the door to $67,000 and then $70,000.
But confirmation requires volume and likely some catalysts. The weekend typically has lower liquidity, so a move to $65,400 may take time. If Bitcoin fails to break above the trendline, a retest of $60,000 is possible.
Bullish scenario: Bitcoin holds above $60,000, breaks above the descending trendline, and pushes toward $65,400. Sustained volume confirms the move. From there, $67,000 and $70,000 become the next targets.
Bearish scenario: Bitcoin fails to break above the trendline and rolls over. A retest of $60,000 comes first. A break below $60,000 would invalidate the bullish signals and open the door to $58,000.
Our take: The three signals are legitimate. The divergence is clear. The SuperTrend flip is objective. But the market is still in a bear trend until proven otherwise. A break above $65,400 would be the strongest signal bulls have had in weeks.
Subscribe to our YouTube channel for daily crypto updates, market insights, and expert analysis.