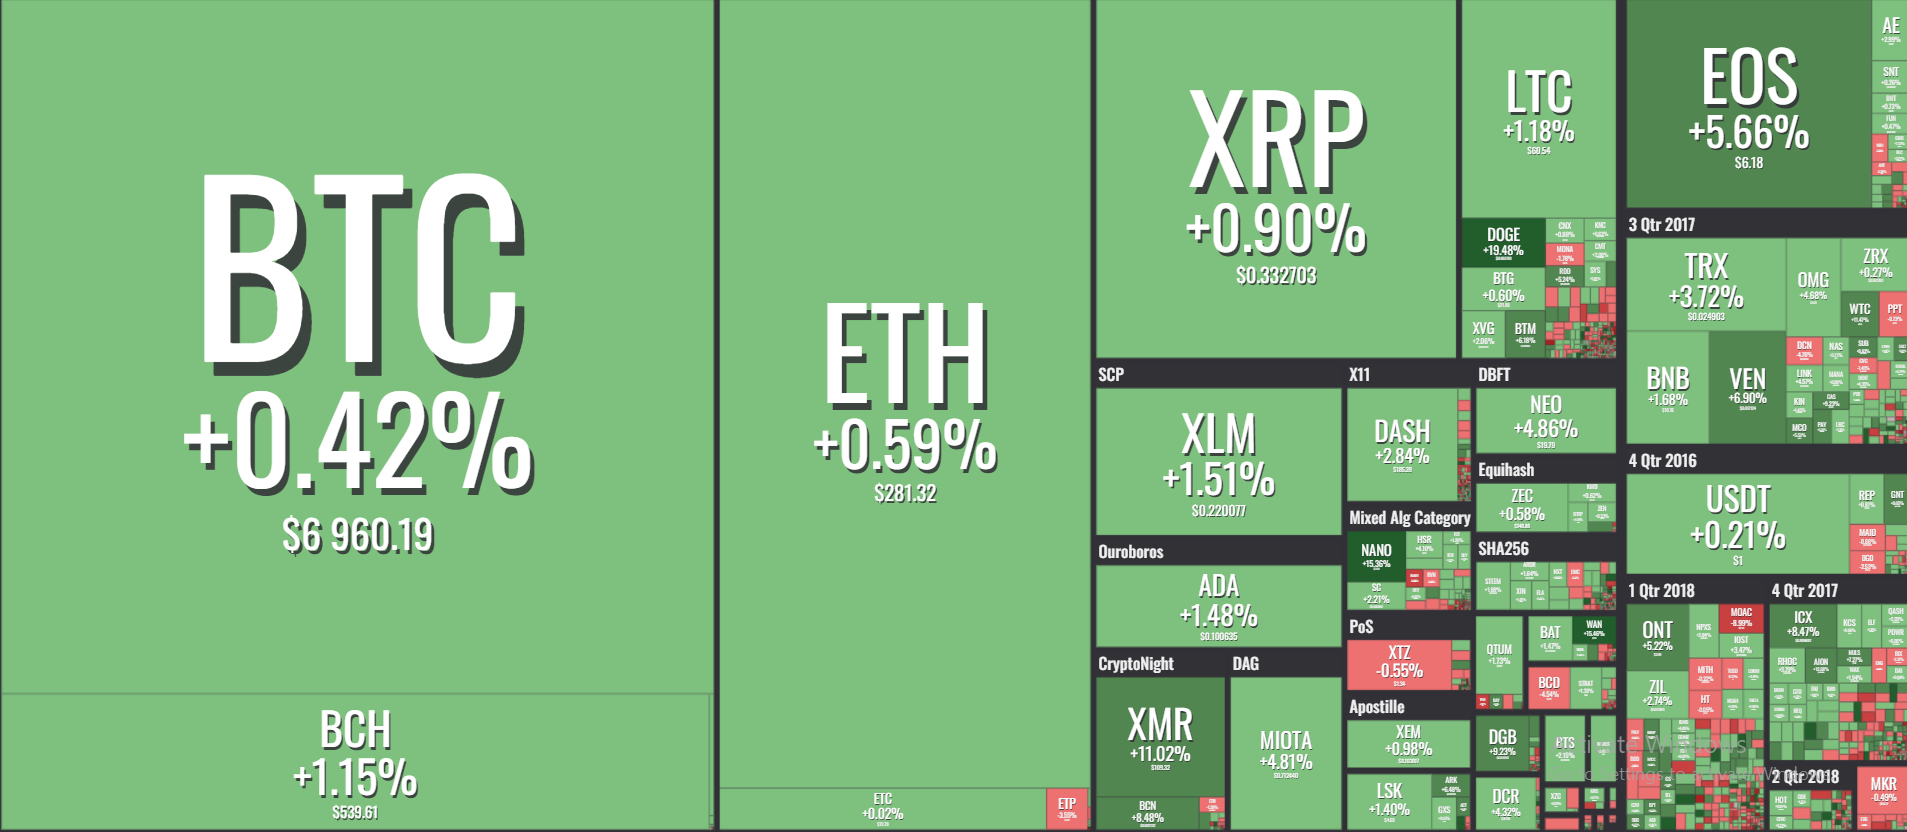
The market retraced yesterday and the consolidation before the next move seems to be on. Bitcoin apparently couldn’t wait for this as we saw one strong green candle which bounced the price off the $6800s into $6900s area. The retrace was pretty deep but some people thought this might be a bullish sign in the long run.
Retraced deeper than expected.. but I would be surprised if we didn't bottom here.
This deeper retrace is making me feel even more macro bullish. I'd much rather a slow grind up than any chad candle.
Close above blue is confirmation imo pic.twitter.com/uBeSAFv5J9
— Crypto (@coin_signals) August 30, 2018
We checked out the general sentiment across the board:
Bitcoin (BTC)
FredericMalta gave a detailed overview of both the bear and bull arguments for the upcoming run. Trader alanmasters described the ascending channel he noticed on the graph and the support/resistance levels that are currently supporting Bitcoin:
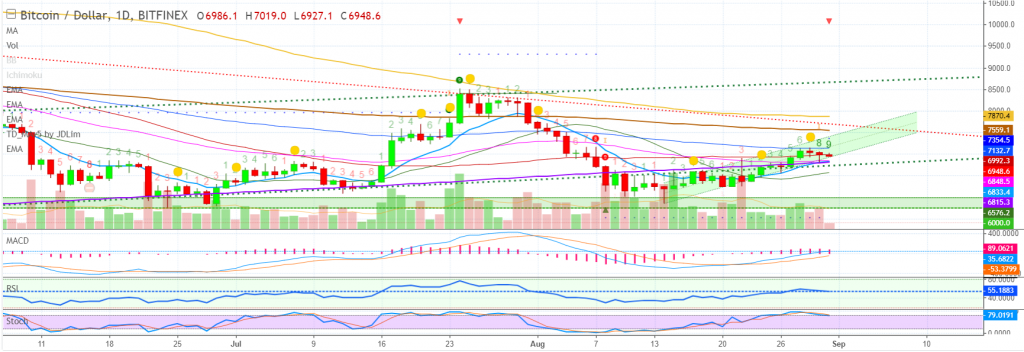
“We are trading in an ascending channel. Bitcoin -0.17% has strong support marked by trend line, moving averages and fib. support. Right now Bitcoin -0.17% is retracing, letting off pressure, to prepare for another push up.”
As for the support/resistance levels, he notes the following:
“After we hit $7300-$7500, we can revisit the chart to mark our next target. For support we are looking at mainly $6800 followed by $6550+.”
His complete analysis contains more data about the chart, signals and indicators he noticed so be sure to check that out here. Meanwhile, Rilez noticed a Wyckoff accumulation forming on the chart some time back and felt the latest movements confirm his earlier prediction:
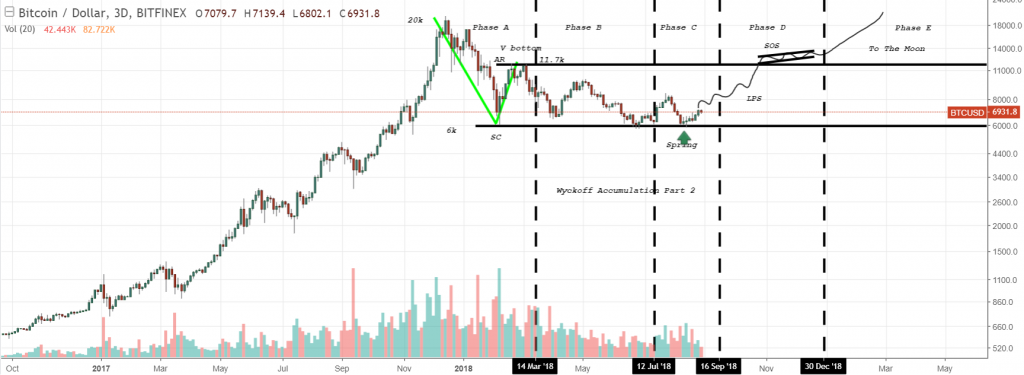
“This is Part 2 from my last Wyckoff accumulation I did on the 4h time frame. I did this one on the 3 day time frame and you can clearly see capitulation from 12.9k down to 6k where we form our SC then make a violent V bottom that everyone is waiting for back up to 11.7k where our AR is formed. After that we fall down to 6k for a second time where we form our ST in phase B. Now we are currently in phase c of accumulation and have bounced off 6k again and I expect this is the start of the spring up to $8,500 retest and if we break that it will confirm the Wyckoff accumulation.”
You can see what he feels will happen in phase D and if he’s overall bullish or bearish here. Finally, botje11 thinks BTC is ALMOST set for the long term move upwards. He shares how he predicted a week or two ago that the $5850/$6600 action was just an accumulation phase, a sentiment which many long-term bullish traders shared. On the daily there are quite a few support levels visible around $6000, which Bitcoin touched several times in 2018. He also describes how retail FOMO was responsible for the post-April downtrend, when Bitcoin got rejected at $10k and took a nosedive into the red.
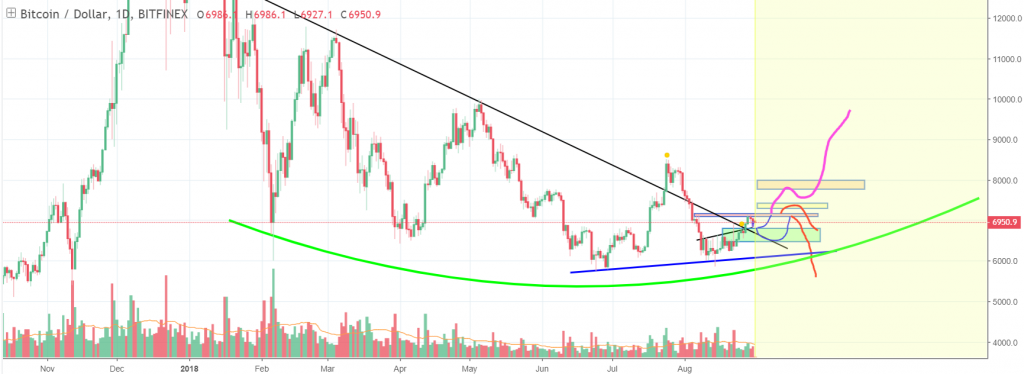
“For the coming days/week i see several options. Assuming the market is still bullish, i want to see it stay above the 6500ish. Best case we have set the low already today and we continue the rally to keep the speed of the rally at its highest. The 7150 is an important level; it was a big resistance a week ago and this time once again. I think that if we go towards the 7100/7150 again within the next 2 days, i am quite sure it will break. As i mentioned the past few weeks, the 7300/7400 is the turning point for me between mid-term bull and bear market. So what i am thinking is, if we break the 7150 within the next 24H, the 7400 will most probably break as well. Assuming it will happen like that, the 7800/8000 will probably break as well and if that happens, the 8500 will just be a matter of time IMO -1.24% . This is the purple line version.”
Check the full analysis here to see what he thinks about the red version and which one he feels is more likely to happen.
Ethereum (ETH)
Sherem thinks Ethereum is consolidating for its next move:
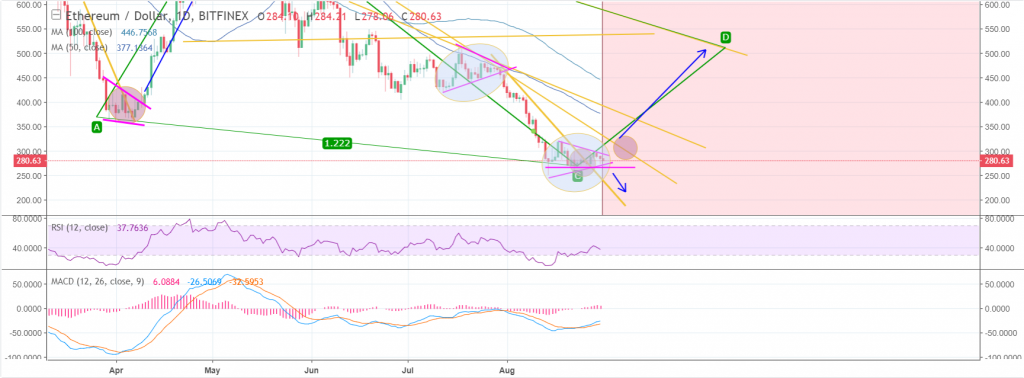
“ETH/USD has been in the process of consolidating down here for a substantial amount of time. In my previous update, I stated that most of the minor downtrend lines had been broken, but we are potentially forming a downward continuation pattern right now since we haven’t broken to the upside. See the 2 blue circles highlighted comparisons. As much as I think it’s going to move to 500 by the end of September, it’s key we don’t let our emotions get in the way and look at the possibility that it could continue down.”
His complete analysis will tell you more about the previous analysis he mentions as well as the potential scenarios that could unfold here. @CacheBoi thinks this upcoming scenario won’t be a positive one:
https://twitter.com/CacheBoi/status/1035329229179760640
Ripple (XRP)
Trader easyMarkets offered his XRP insights:
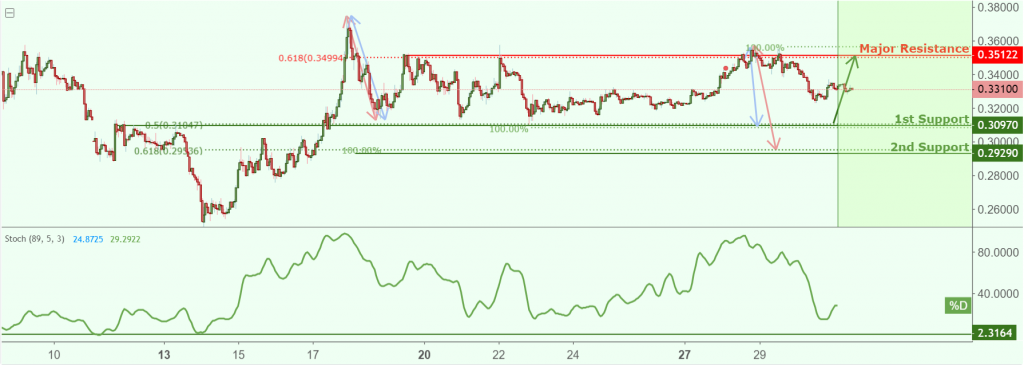
“XRPUSD is approaching our support at 0.3097 (horizontal overlap support, 100% Fibonacci extension, 50% Fibonacci retracement) and a strong bounce might occur above this level pushing price up to our major resistance at 0.3512 (horizontal swing high resistance, 100% Fibonacci extension, 61.8% Fibonacci retracement). Stochastics (89,5,3) are approaching support where a bounce above this level might see a corresponding rise in price.”
Other thoughts
There was plenty of green across the entire market today but the most notable performer was once again Dogecoin, which currently sits on 23% gains in the last 24 hours. In that same timeframe, Nano (16%), Wanchain (16%) and their interoperability alliance partners Aion (11%) and ICON (10%), Monero (10%) and Waltonchain (10%) all recorded double digit gains. Meanwhile there were only nine coins in the red, with MOAC leading the pack at 7.84% loss. Overall, the retracement seems to have halted for now and a period of accumulation for the next move is upon us. This move could come sooner rather than later so be sure to set your positions in time.


