
The BTC price kicks off September 2 stuck between geopolitical trouble and steady institutional money. It dropped from $79,000 to around $76,000 in a single day, now at $77,344 on the chart, this after a 25% run-up in August.
The trigger is that the U.S. launched strikes on Iranian targets after attacks on commercial ships in the Strait of Hormuz. That sell-off liquidated over $100 million in crypto positions within an hour.
But here’s the other side: demand hasn’t cracked. Bitcoin ETFs pulled in nearly $1 billion just last week. Total August ETF inflows hit about $2.8 billion. And BlackRock’s IBIT alone has brought in roughly $1.2 billion so far this year.
So can the Bitcoin price climb back above $78,403 and take a shot at $79,380?
What you'll learn 👉
Bitcoin Price Faces Geopolitical Pressure
US forces struck IRGC targets in southern Iran on September 1 after attempted attacks on commercial shipping and US forces, with explosions reported around Bandar Abbas, Chabahar and Qeshm.
The BTC price has a demand zone below the market. On-chain data supplied for this setup places about $118 million in limit buy orders between $69,000 and $76,700 across four addresses.
U.S. spot Bitcoin ETF AUM also reached about $100.39 billion on September 1, up from $77.6 billion a month earlier. August ETF flows were around $2.8 billion, including $1.92 billion in the week of August 17 and $923 million the following week, followed by a $203 million outflow on August 28.
Strategy adds another institutional data point. The company purchased 4,603 BTC for about $369.7 million between August 24 and August 30 at an average of $80,318, taking its holdings to 845,050 BTC at an average cost of $75,412.
Catalysts That Could Move Bitcoin Price Tomorrow
The scheduled catalyst is the ADP Nonfarm Employment Change. The September 2 forecast is 48,000 private-sector jobs versus 44,000 previously. The report gives traders an early read on employment growth before the government jobs report, using payroll data from millions of workers.
A stronger print could support the dollar and pressure the Bitcoin price if rate-cut expectations weaken. A weaker print could help risk assets by increasing expectations for easier monetary policy. That makes the ADP release important for the $78,403-$76,670 range: a break of either level could set the next intraday direction.
What the Bitcoin Chart Is Saying
We had a look at the chart, and the first issue is the loss of the short-term range around $78,500.
The BTC price moved from the mid-$76,000s toward $81,000, then rejected the upper range. The $78,403 level is now the key 4-hour obstruction. Reclaiming it would open the way toward the $79,380 daily high.
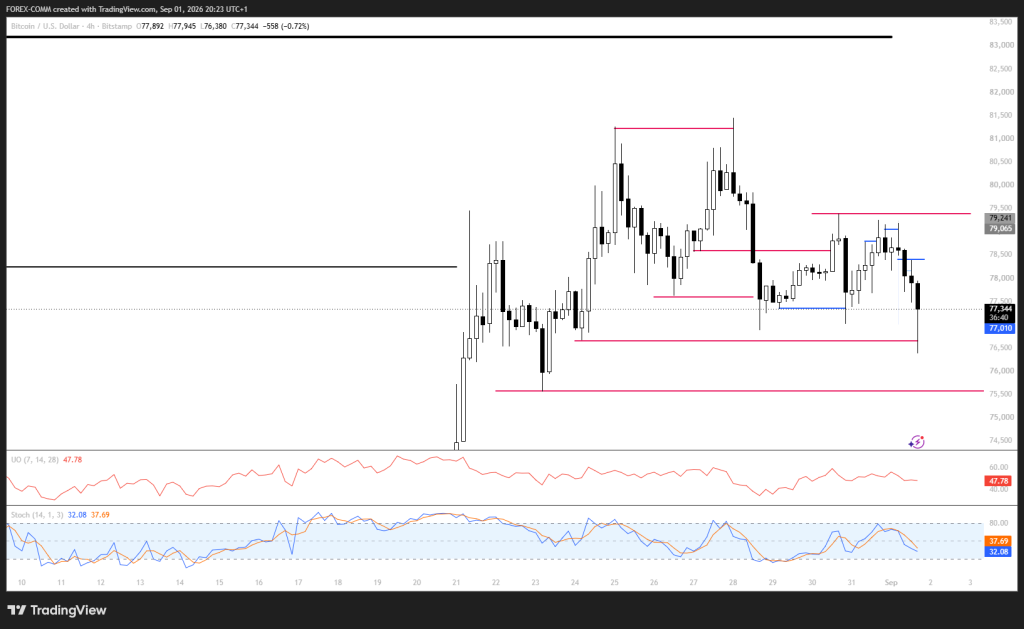
Momentum has cooled too. The Ultimate Oscillator is 47.78, below 50, and the Stochastic readings are 32.08 and 37.69, both below the midpoint. That leaves short-term momentum vulnerable to another selloff if buyers cannot recover $78,403. The marked $76,670 level is the main reaction zone, with the latest candle also probing the $76,000 area.
Above $79,380, the next major zone is $81,000-$81,200, close to the 50-day moving average near $81,000. The Bitcoin price needs to recover $79,380 and then clear the $81,000 area to repair the rejection from the upper August range.
Below $76,670, the chart gives a clear downside map: $74,269 first, followed by $72,641 and then $67,396. These weekly PD arrays become relevant if sellers keep the Bitcoin price below the daily reaction zone.
Related Bitcoin News: We Asked 3 AI Models Where Bitcoin (BTC) Price Will Be at the End of September
Where Could BTC Price Go Today?
If things go right, Bitcoin needs to defend $76,670 first. From there, if it can push past $77,344 and reclaim $78,403, then $79,380 is the next stop. Clear that, and $81,000–$81,200 comes into play, followed by $83,200–$83,500.
If things go wrong, $78,403 keeps rejecting the Bitcoin price and loses $76,670. That opens the door to $74,269, then $72,641. For today, $78,403 is the clearest line between a recovery and another drop.
The main zone to watch is $76,670 on the low end and $79,380 on the high end. Hold the low, and the recovery story stays alive, then it’s about taking $78,403 and $79,380. Lose it, and $74,269 and $72,641 come next, with $67,396 further down as deeper support.
Institutional money is still buying, which helps balance out the geopolitical selling pressure. But on the chart, Bitcoin needs to get back above $78,403 before the short-term picture turns positive again.
Frequently Asked Questions
Subscribe to our YouTube channel for daily crypto updates, market insights, and expert analysis.