Bitcoin (BTC) And XRP Price Predictions For November: The Best And Worst Case Scenarios


Bitcoin and XRP are heading into November after October’s repeated recoveries failed to end their downward trends. Each rebound has faced renewed selling, and both assets are now close to support levels that could determine how the next month unfolds.
The November outlook brings competing possibilities. Economic reports, ETF demand and regulatory developments could help buyers regain control, but the technical picture still leaves room for further declines. The crucial question is whether either asset can break its descending pattern before support gives way.
What you'll learn 👉
Bitcoin’s October Decline Leaves Its November Recovery Dependent On A Breakout
Bitcoin’s recent price movements show a clear sequence of lower highs and lower lows. BTC rebounded from approximately $82,700 to $86,900 before declining toward $80,400. The recovery that followed stopped around $84,800, below the previous peak.
Selling then pushed Bitcoin toward $79,400 before another rebound reached approximately $81,900. The latest decline extended toward $76,550, which continued the downward pattern that developed toward the end of September.
This structure matters because a recovery toward $79,000 or $80,000 would still fit within the descending channel. Bitcoin could reach those levels and face another decline without changing its broader direction.
The $75,000 to $75,500 support zone is particularly important for November. A successful defence would preserve the possibility of a recovery, although repeated tests could weaken that defence.
Bitcoin needs a sustained breakout above the channel and $81,000 to improve its outlook. That would create a route toward $85,000, followed by $87,000 if buying pressure continues.
Inflation Reports And ETF Flows Could Drive Bitcoin Price In November
The Federal Reserve held its benchmark rate at 3.75% to 4% on October 28 and maintained that inflation remained elevated. That decision leaves November’s economic reports important for expectations about the next policy move.
Persistent inflation could keep borrowing costs elevated and support the dollar, which could weigh on Bitcoin. Softer inflation alongside stable economic activity would provide a more favourable backdrop for a recovery.
ETF demand also remains relevant after uneven October flows. US spot Bitcoin ETFs recorded approximately $635.6 million in net outflows on October 22, followed by $137.3 million in net inflows on October 28. Sustained inflows would offer stronger support than occasional positive sessions.
The $81,500 area also deserves attention as a potential recovery barrier. Bitcoin would need to reclaim nearby resistance before institutional demand could support a move toward $85,000 to $87,000.
Political developments could influence expectations about crypto legislation during November. However, improved sentiment would need to translate into actual demand before it could help Bitcoin escape its downward channel.
Bitcoin’s Daily Indicators Show Sellers Retain The Advantage
Bitcoin’s RSI(14) reads 36.871, below the neutral midpoint of 50. Momentum remains weak, although the indicator has not reached the conventional oversold threshold of 30.
The MACD(12,26) reading of −852.202 reinforces the bearish trend. A negative value shows that the shorter moving average remains below the longer moving average. The signal line and histogram would help establish whether that weakness is easing.
The Ultimate Oscillator reads 47.245, which also places momentum below its midpoint. This offers limited confirmation that the recent rebound can develop into a sustained recovery.
Bull/Bear Power(13) reads −5,857.9943, consistent with continued selling pressure. Collectively, these indicators support caution until Bitcoin confirms a breakout through resistance.
Read Also: SUI Launches Asset Transfers on Mercado Bitcoin in Brazil
Bitcoin Price Predictions For November Include Recovery And Breakdown Scenarios
- Bullish scenario: Bitcoin breaks above the descending channel and $81,000 before reclaiming $85,000. A further move through $87,000 would open the route toward $90,000 and potentially $94,000.
- Neutral scenario: Buyers defend $75,000, but recoveries repeatedly fail near resistance. Bitcoin could spend much of November between $75,000 and $84,000.
- Bearish scenario: Bitcoin loses $75,000 and fails to recover that level. The next downside targets become $70,000 and $67,000.
XRP’s October Decline Brings $1.14 Support Into Focus
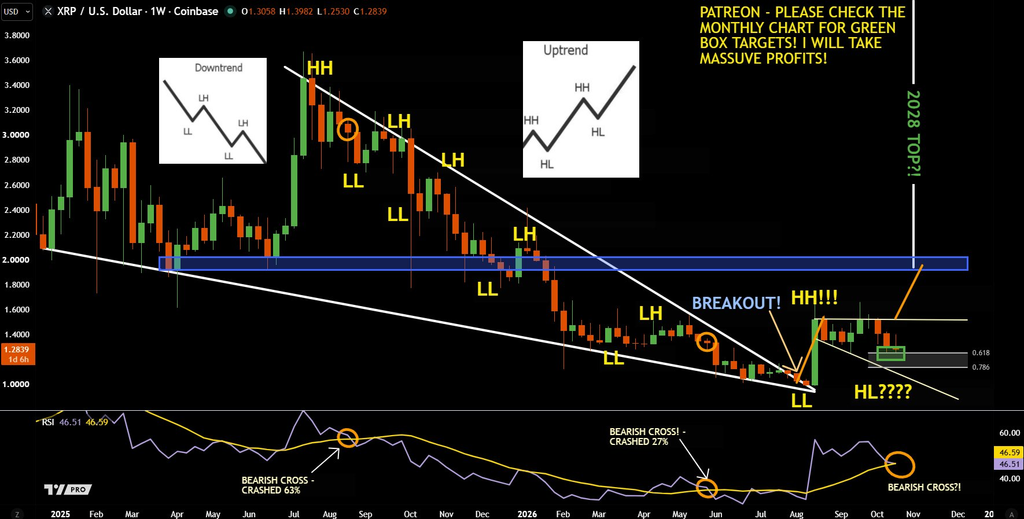
XRP has followed a similar downward pattern through lower highs and lower lows. Its latest decline reached approximately $1.19, which leaves buyers under pressure as November draws closer.
A recovery from this area could take XRP toward $1.30 to $1.32. However, that move would remain part of the descending channel unless the price breaks above its upper boundary.
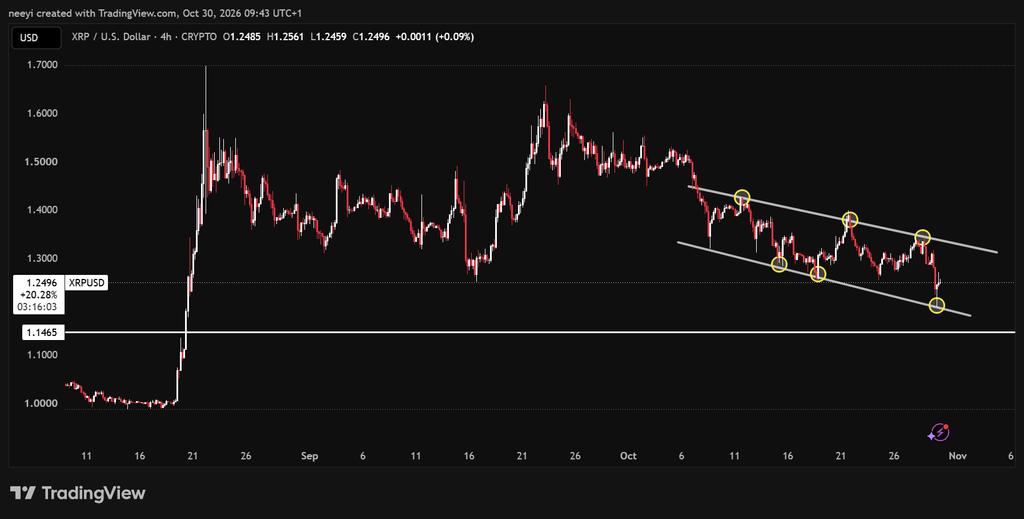
Another rejection could bring $1.17 into focus before a deeper test of $1.14. The latter represents the stronger support level in the November outlook.
A sustained break below $1.14 would weaken the recovery case and expose $1.00. Conversely, a successful channel breakout would open a route toward $1.42, followed by $1.69 to $1.70 if demand strengthens.
Ripple Escrow And Institutional Demand Could Influence XRP Price In November
Ripple’s monthly escrow releases remain relevant to XRP’s supply outlook. However, unlocked XRP does not automatically enter the market because unused amounts can return to escrow. The important measure is how much becomes available for distribution relative to demand.
November also marks the first anniversary of Canary’s spot XRP ETF, which began trading on November 13, 2025. A longer performance record could support institutional evaluation, although the anniversary itself does not guarantee fresh allocations.
WisdomTree’s earlier XRP fund filing should not be treated as an upcoming approval catalyst. The company requested withdrawal of that registration statement in January 2026 after deciding against proceeding with the offering at that time.
Ripple’s October announcement of final OCC approval for its national trust bank provides another development to monitor. Its approved activities include RLUSD reserve management and fiduciary custody. XRP’s price response will depend on actual demand rather than the approval alone.
XRP’s Daily Indicators Keep the November Outlook Cautious
XRP’s RSI(14) reads 35.588, which indicates weak momentum without confirming an oversold reversal. Buyers need stronger price follow through before the indicator supports a more constructive outlook.
The negative MACD reading supports the bearish direction, although its numerical scale requires confirmation against the original indicator display.
The Ultimate Oscillator reads 43.864, below the neutral midpoint. Negative Bull/Bear Power also supports the view that sellers retain control.
Read Also: Silver Price Today: Silver Crashes 3% as Post-Fed Selling Returns
XRP Price Predictions For November Depend On Support And Resistance
- Bullish scenario: XRP breaks above its descending channel and clears $1.30 to $1.32. The next target becomes $1.42, followed by $1.69 to $1.70.
- Neutral scenario: XRP holds $1.14 but struggles to clear resistance. Price could remain broadly between $1.14 and $1.32.
- Bearish scenario: XRP loses $1.17 before breaking its stronger $1.14 support. That would expose a possible decline toward $1.00.
Subscribe to our YouTube channel for daily crypto updates, market insights, and expert analysis.