Bitcoin and Altcoin Holders: The Most Aggressive Crypto Sell‑Off in Years Just Reached a Turning Point
Cryptoinsightuk posted a detailed analysis on X yesterday examining the total crypto market cap and recent price action. His goal: find answers about whether the pain is over. He acknowledges that no one can predict the future with certainty, but his observations offer a useful framework.
He attached a few weekly charts from CRYPTOCAP that show the total market cap currently at around $2.5 trillion. The pullback from the all‑time high has been severe. But the data reveals something surprising about this cycle.
What you'll learn 👉
The Speed of Decline Explains the Negative Sentiment
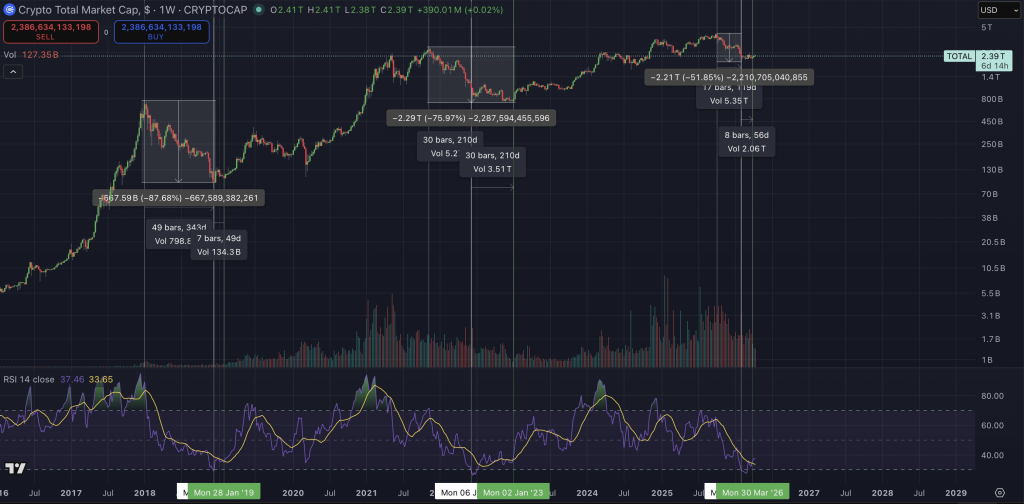
From the recent highs, the total market cap dropped 51.85% in just 119 days. That is an average loss of 0.435% per day. In the 2021‑2022 bear market, the drop was 75.97% over 210 days – an average loss of 0.362% per day.
In the 2018‑2019 cycle, the decline took 343 days with an 87.68% drop – only 0.256% per day. So even though this pullback is smaller in total percentage, it has been more aggressive on a daily basis. That explains why sentiment has felt so terrible. The speed of the move down is one of the most aggressive ever recorded.
The Weekly RSI Just Flashed a Bullish Cross
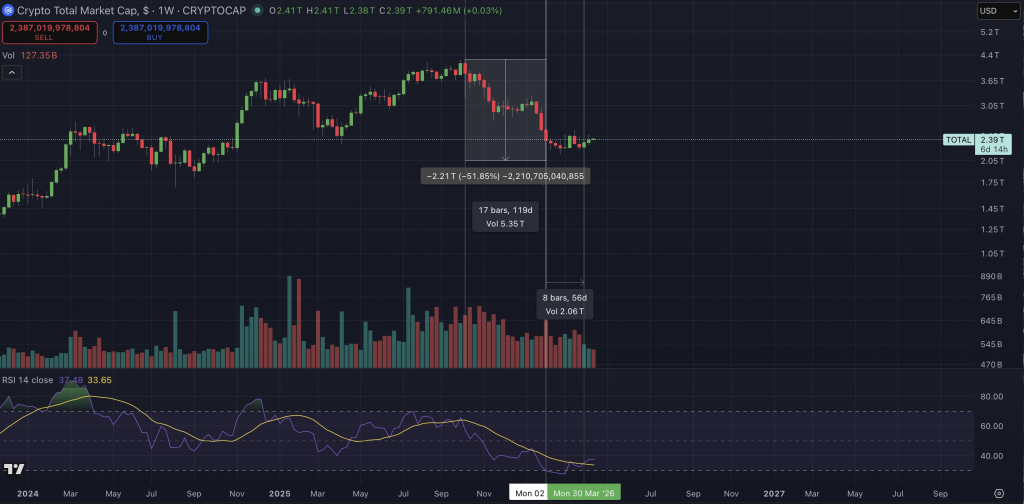
Historically, it has taken anywhere between 49 and 210 days for the weekly RSI to put in a significant bullish cross. That cross has marked areas where strength returned. Right now, we are around day 56 and have potentially just seen that bullish cross.
The first chart shows the RSI (14, close) at 37.48, up from 33.65. The line is turning up. The second chart confirms the same pattern. In 2019, the bullish cross took around 49 days – seven weeks. This time, it is about eight weeks (56 days). The signal is remarkably similar.
After the 2019 bear market low, the market did not immediately explode higher. But it did begin to grind up from there. Cryptoinsightuk notes that if this cycle resembles 2019 more than 2022, we might see a push higher followed by a potential retest.
He also raises a bigger question: could this resemble the March 2020 COVID dip during Trump’s first term? That was a sharp V‑shaped recovery. The speed of the current decline might point to a faster rebound than previous cycles.
Read also: Gold Price Prediction: Swiss Bank UBP Says $6,000 by Year‑End – But ETFs Just Saw Record Outflows
Cryptoinsightuk concludes that there is a fair argument, based on RSI behavior and the bullish cross, that this could be the low. The rate of decline has been more aggressive than ever, which explains the extreme negativity.
But that same speed could mean a shorter correction and a faster recovery. Bitcoin and altcoin holders have endured a brutal 119 days. The weekly RSI cross indicates the turning point may finally be here.
FAQs
Subscribe to our YouTube channel for daily crypto updates, market insights, and expert analysis.