A quick look at BTC price and XRP price right now feels like watching two athletes pausing on the same starting line. Both charts sit on support levels that have triggered strong rebounds before. Could this be the best point to buy Bitcoin and XRP before another move?
The answer depends on how these supports behave in the coming days, because both Bitcoin and XRP have returned to price zones that shaped previous rallies. The charts highlight levels that have acted like springboards during past pullbacks, and the current setup looks very similar.
XRP Price Trades on a Support That Has Triggered Multiple Rebounds
XRP trades around $2.04 and sits on a horizontal support that has held since December 2024. The XRP token has bounced off this zone many times for almost a year. Every touch created a reaction, and the market never managed to break through it with conviction. This history makes the level a natural area buyers tend to revisit.
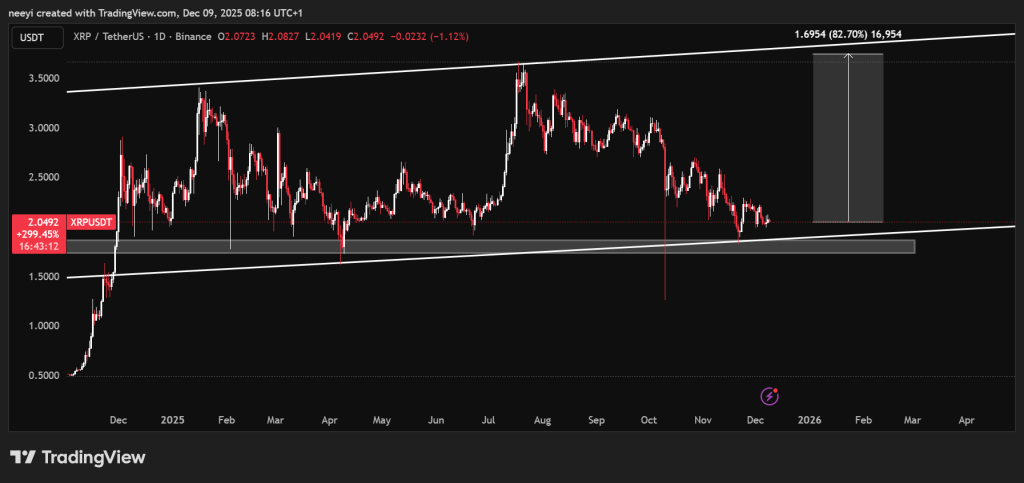
A rising trendline from late 2024 also meets the current price. The XRP token tested this trendline several times on its way up. Price now sits almost exactly where previous rebounds formed. The structure still respects an ascending channel, and the upper boundary of that channel suggests room for an XRP spike if momentum returns. The pattern points toward a potential move that could challenge the previous high near the top of the channel.
A failure of the support zone would flip the picture. Price could fall toward $1.30, which sits near the lower area that aligns with previous liquidation wicks. Such a move would surprise many traders because the level has not broken down in a full year. These reactions show why XRP price is at a key point where patience and caution matter.
Bitcoin Price Retests a Long-Term Trendline That Shaped Every Major Rally
BTC trades near $90,000 and rests on a trendline that has guided the uptrend since early 2023. Every major pullback paused on this line. Each time Bitcoin touched it, BTC price formed a higher low and created the next leg toward fresh highs. The current position mirrors those moments.
The last rally broke into the $120,000 region, and the structure suggests that a clean bounce here could open the door for another attempt to break above $126,000. The simplicity of the pattern makes it easy to understand why this zone attracts attention. The line has not failed once in almost 3 years.
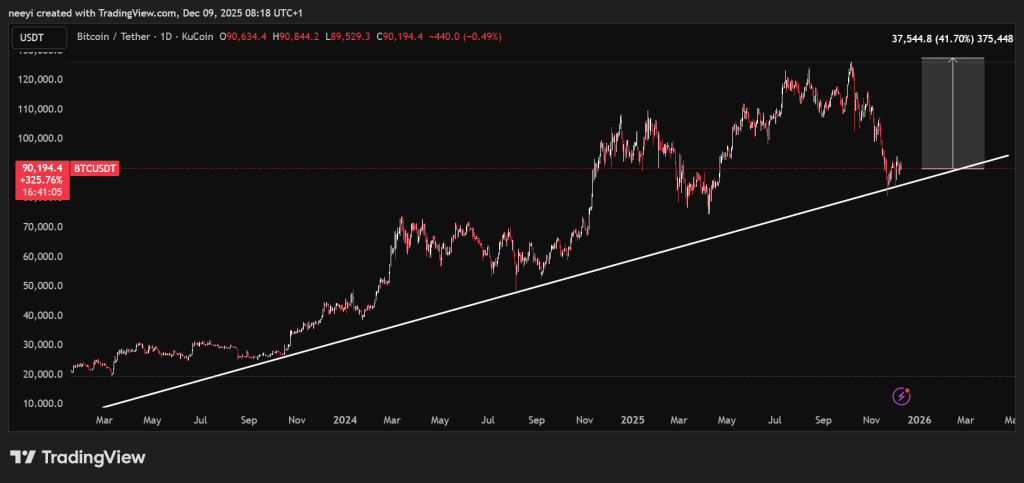
A breakdown would change the story quickly. Price could slide toward $75,000, a region that sits near older consolidation zones. Such a dip would align with how BTC usually behaves when a long-term trendline finally cracks. The move could become sharp because it would trigger liquidation levels built up during the climb.
Both assets sit right on the borders that shaped their previous runs. Bitcoin holds a multi-year trendline. XRP holds a yearly support and an ascending channel. These levels helped define each rally that followed.
Read Also: Why Is Shiba Inu (SHIB) Price Up Today?
The charts do not promise what happens next. They simply show that BTC price and XRP price both stand at places where strong moves often begin. Whether the next move is up or down depends on how these supports behave, and the market rarely stays quiet when price sits this close to long-tested lines.
Subscribe to our YouTube channel for daily crypto updates, market insights, and expert analysis.