In a recent analysis, XForceGlobal, a top analyst, draws intriguing comparisons between ADA’s latest price action and Solana’s (SOL) price movements before its explosive rally.
Based on the Elliott Wave Theory, the analysis reveals optimism and caution for ADA holders. The Cardano price hovers around key support levels, and if bulls manage to defend these zones, ADA could experience a similar rally to Solana.
What you'll learn 👉
Cardano Chart Analysis: Wave Structure Indicates Potential for ADA Rally
Cardano’s macro chart analysis suggests that ADA’s price has completed a full Elliott Wave impulse cycle, marked by five waves. After reaching its peak price, Cardano entered a corrective phase with downward price movements categorized as A, B, and C waves.
This corrective structure highlights consolidation periods and a potential bottom forming near $0.30 to $0.25, as indicated by the ADA chart’s Wave (2).
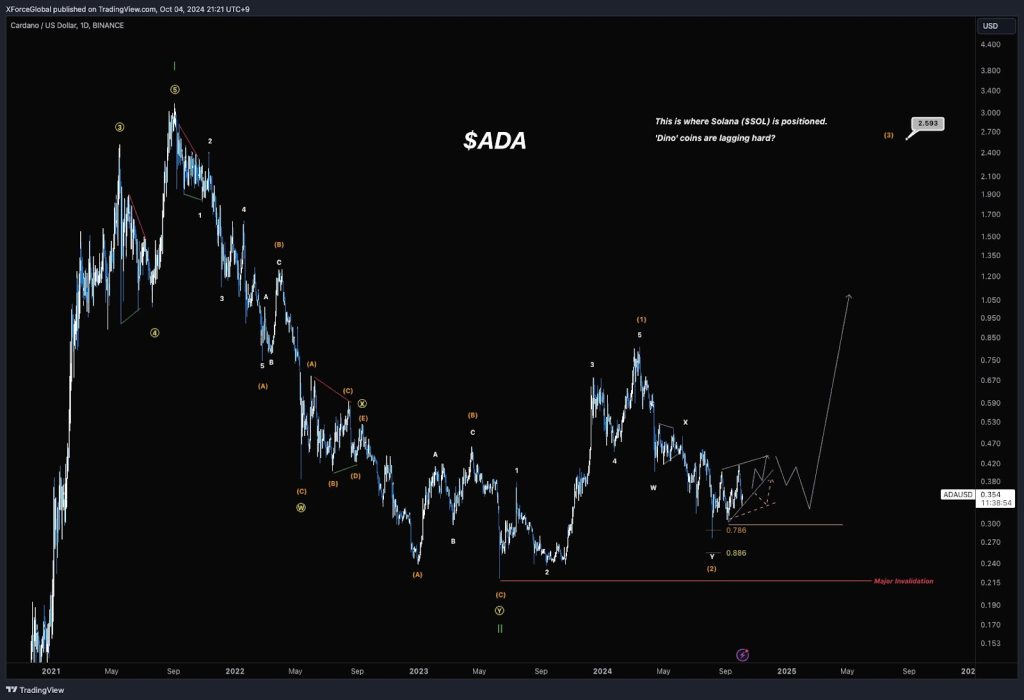
XForceGlobal emphasizes the importance of ADA defending this protected low. If the price holds above these key Fibonacci retracement levels, specifically the 0.786 and 0.886 levels, it could lead to a strong reversal, much like Solana before its rally.
Doge2014 raises 500K in days celebrating Dogecoin. Make potentially big profits and get in on exclusive airdrop!
Show more +Fibonacci and Support Levels Could Signal Reversal
One of the critical aspects of the Cardano chart is the Fibonacci retracement levels that act as support around $0.35.
These zones are pivotal for the bulls, as a failure to maintain support could push ADA’s price toward the major invalidation point at $0.23. This level, if breached, would likely invalidate the bullish structure and lead to further downside pressure.
However, if ADA holds above these retracement levels, the ADA chart shows a potential bullish path toward $1 or higher. XForceGlobal’s analysis compares this scenario to Solana’s price action before its rally, signaling that ADA could be on the verge of a similar move.
Read Also: Solana (SOL) Price Set to Explode? Two Charts Suggest a Potential Major Rally Ahead
Comparison to Solana’s Rally
XForceGlobal chart explicitly states that ADA’s current structure mirrors that of Solana (SOL) before its significant upward movement. The analyst notes that Solana was in a similar consolidation phase before breaking out to new highs. If ADA follows a similar trajectory, it could result in a major price rally in the coming months, contingent on holding key support levels.
This comparison has generated optimism among ADA investors, although caution is advised. The market sentiment remains hopeful, but ADA’s price action will largely depend on whether bulls can maintain control and defend critical support levels.
XForceGlobal further emphasizes a cautiously optimistic outlook for Cardano’s future price movements. While the potential for a rally exists, investors are reminded to watch the key support zones around $0.30 to $0.25. A failure to hold these levels could lead to bearish outcomes, whereas a successful defense could pave the way for an upward surge similar to Solana’s.
Subscribe to our YouTube channel for daily crypto updates, market insights, and expert analysis.
We recommend eToro
Wide range of assets: cryptocurrencies alongside other investment products such as stocks and ETFs.
Copy trading: allows users to copy the trades of leading traders, for free.
User-friendly: eToro’s web-based platform and mobile app are user-friendly and easy to navigate.


