
XRP’s market dynamics are shifting as analysts reassess its technical structure and potential trajectory. Investors are now watching key support levels and momentum shifts to gauge whether a rebound is on the horizon.
Analyst XForceGlobal has revised their macro analysis of XRP, focusing on market inefficiencies and wave structures. According to their latest update, they have adjusted their Elliott Wave count to maintain the integrity of a five-wave impulse pattern.
A key factor in this assessment is the 50% bounce, which presents an opportunity for the fifth wave to complete—provided a protected low remains intact. The anticipated pullback has already occurred, fulfilling the minimum conditions needed for further upward movement.
$XRP
— XForceGlobal (@XForceGlobal) February 5, 2025
Primary Macro Analysis
Considering all market inefficiencies on the micro timeframes, this is how I would adjust our count to preserve the integrity of a proper 5-wave impulse.
With a 50% bounce, there's an opportunity to complete this 5th wave, so long we have a protected… pic.twitter.com/SCU4U1YTUO
Additionally, their post-triangle thrust measurement aligns with previous projections, keeping the $5 to $10 target range in play. However, they noted that these targets would be refined as price action unfolds.
Despite the bullish outlook, XForceGlobal cautioned that continued market distribution could push XRP back into an earlier scenario, signaling uncertainty in short-term price action. They have downgraded their idea due to a missing element in their criteria for a wave 1-2 formation.
Specifically, they pointed out that distribution, whether in terms of time or size, has yet to be fully realized. Without this condition, they remain cautious about XRP’s trajectory. While their overall analysis remains positive, they stress the importance of monitoring market developments closely as they refine their targets
Read also: Whale Activity Could Signal a Lido DAO (LDO) Price Surge – Here’s What to Watch
XRP Technical Indicators and Key Support Levels
XRP shows signs of bearish momentum, with its RSI reading at 38.46, indicating a move below the neutral midpoint. The secondary line at 54.29 suggests weakening bullish pressure, but XRP hasn’t yet reached oversold levels.
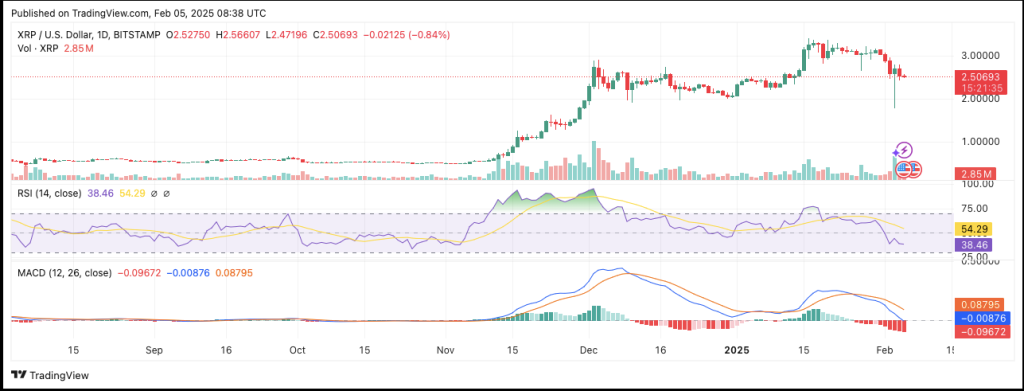
The MACD line crossed below the signal line at 0.08795, suggesting bearish momentum. The histogram shows negative values, indicating increased selling pressure. On the chart, support levels lie between $2.4 and $2.5, where XRP may stabilize before its next move.
Despite a strong bullish run in late 2024, the XRP daily price chart indicates a correction phase. At press time, XRP trades at $2.51 according to CoinGecko. The Ripple token has declined in price over the past day and week.
Follow us on X (Twitter), CoinMarketCap and Binance Square for more daily crypto updates.
Get all our future calls by joining our FREE Telegram group.

We recommend eToro
Wide range of assets: cryptocurrencies alongside other investment products such as stocks and ETFs.
Copy trading: allows users to copy the trades of leading traders, for free.
User-friendly: eToro’s web-based platform and mobile app are user-friendly and easy to navigate.