Top analyst EGRAG CRYPTO projects XRP’s potential price surge to $33 by May, citing historical price cycles and technical indicators. This forecast draws comparisons to XRP’s explosive 2017 rally.
While price movements remain uncertain, technical analysis suggests a bullish outlook if key levels hold. Crypto analyst EGRAG CRYPTO shared insights on XRP’s price trajectory, highlighting a repeating pattern from 2017.
#XRP – Snapshot 🖼️Cycle ($27-$33 by May 2025)
— EGRAG CRYPTO (@egragcrypto) March 4, 2025
Sometimes, I throw myself under the bus with time predictions ⏳, but honestly, it’s worth sharing with the community! Even though I know it might backfire, I still give it a shot.
Now, let me be clear—I never try to time the market… pic.twitter.com/hke20QC11Q
According to his analysis, XRP’s previous breakout cycle took 175 days and delivered a 2,500% gain from its channel low. He suggested a similar setup is forming, with XRP potentially surging to $27-$33 if history repeats itself.
EGRAG CRYPTO emphasized that timing the market is difficult but noted that XRP’s price action is aligning with past trends. He pointed to the 21-week EMA closing above a key level, indicating bullish momentum.
Based on the 2017 cycle, he suggested that the anticipated price move could occur within 28 days once triggered.
Related: XRP Price Prediction as Ripple Whales Go on a Buying Frenzy
What you'll learn 👉
Key XRP Technical Levels and Indicators
XRP is showing signs of life in the crypto markets, currently hovering around $2.43. The digital asset has been making some interesting moves lately, bouncing between $2.21 and $2.52 in recent trading. While it’s been stuck in a bit of a holding pattern, there are hints of potential upward momentum.
The price seems to be gathering strength after a quieter period, with $3.00, a key psychological level. The current technical picture suggests some volatility, with the price recently finding support around the $2.00 range and showing some resilience.
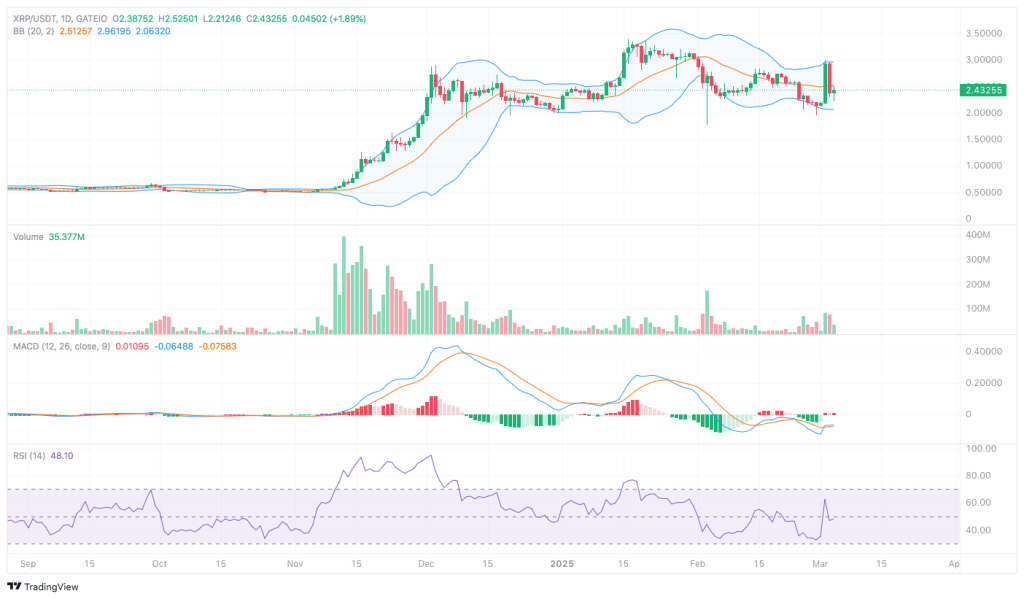
Investors may witness a surge into the $3.00–$3.50 region if XRP can overcome its present resistance and rise over the middle of its most recent trading range.
A possible price move may be fueled by the heightened market activity that the Bollinger Bands are showing. However, failure to break higher could lead to another test of the lower band near $2.06-$2.10.
Volume analysis shows an initial spike during XRP’s recent rally, but buying pressure has since weakened. Sustained volume growth would support an upward continuation, while low activity could result in a pullback.
The formation of green histogram bars on the MACD indicator points to a possible bullish turnaround. A change in momentum could be confirmed by the MACD line’s impending crossover above the signal line.
Furthermore, a neutral phase is indicated by the RSI, which is at 48.10. A rise above 50 would indicate more bullishness, while a move above 60 would push XRP in the direction of the $3.00 resistance.
Read also: How Much Will 10,000 Onyxcoin (XCN) Tokens Be Worth If Bitcoin Hits $150K?
Outlook and XRP Price Levels to Watch
After a previous sell-off, XRP is still in a corrective recovery phase. Failure to stay above $2.20 could result in additional declines, while a surge above $2.50 might cause a retest of the $3.00 resistance.
Support is at $2.20, $2.00, and $1.80, while resistance is at $2.50, $3.00, and $3.50. Analysts predict that XRP may reach new highs above $3.00 if purchasing pressure increases. However, traders should watch for confirmation signals before anticipating a breakout toward $27-$33 by May.
Follow us on X (Twitter), CoinMarketCap and Binance Square for more daily crypto updates.
Get all our future calls by joining our FREE Telegram group.

We recommend eToro
Wide range of assets: cryptocurrencies alongside other investment products such as stocks and ETFs.
Copy trading: allows users to copy the trades of leading traders, for free.
User-friendly: eToro’s web-based platform and mobile app are user-friendly and easy to navigate.