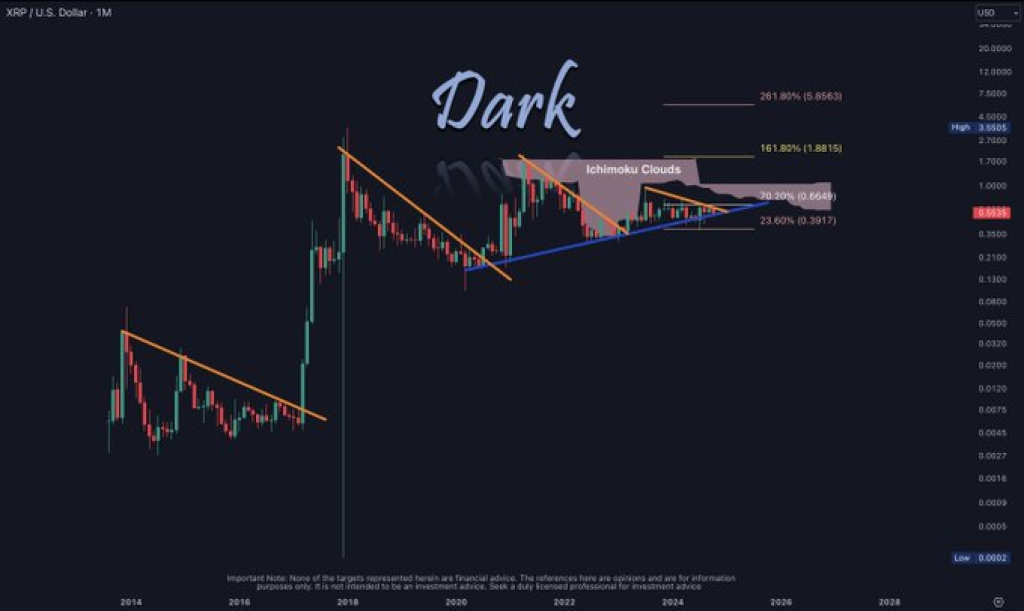
Crypto analyst Dark Defender shared insights on X (formerly Twitter) suggesting that XRP is on the verge of a significant breakout.
Moreover, XRP’s price is approaching a decisive moment, where a strong upward move could be triggered if it surpasses key resistance levels.
Doge2014 raises 500K in days celebrating Dogecoin. Make potentially big profits and get in on exclusive airdrop!
Show more +What you'll learn 👉
Ripple (XRP) Chart Analysis: Symmetrical Triangle and Support Zones
The price movement of XRP indicates a consolidation pattern inside a triangle that is symmetrical. The blue rising line (support) and the orange descending line (resistance) show the sequence of higher lows and lower highs that make up this structure.
Such trends in the past suggest that a breakout is imminent for the price. As the lines converge, Dark Defender points out that “there is no space left,” suggesting that XRP’s price is reaching a point where it will need to decide on its next direction.
The ascending support line has been effective in holding the price up, which indicates steady buying pressure. A shrinking range is produced as a result of the decreasing resistance line’s ongoing pressure. Traders should keep an eye on these lines because a breakout over the resistance level may lead to additional gains.

A technical tool that shows possible regions of support and resistance, the Ichimoku Cloud is one of the chart’s primary indicators. At the moment, XRP is trading below the cloud, suggesting that resistance is present. However, Dark Defender’s analysis emphasizes that a move above the cloud would signal a bullish shift.
In a recent tweet, the analyst remarked, “XRP will be unstoppable when we see the price is over Ichimoku Clouds.” This statement suggests that clearing this resistance zone would likely lead to a sustained upward trend. Historically, price movements above the Ichimoku Cloud often precede strong rallies, adding weight to the prediction.
Fibonacci Levels and XRP Price Targets
The XRP chart also highlights key Fibonacci retracement levels at 23.6%, 16.8%, and 26.18%, which act as possible targets for XRP if a breakout occurs. These levels are often used by traders to predict future price points and identify potential areas of resistance. Should XRP clear the initial barriers, it could aim for these levels, which may lead to further price rallies.
At $0.8889, XRP’s price is still contained within the boundaries of the symmetric triangle. Fibonacci levels and the convergence of the support and resistance lines create the conditions for a crucial breakthrough that could decide the course of the coin.
Read Also: Stellar (XLM) Price Set to Explode? Key Breakout Signals Huge Gains!
Dark Defender’s Tweet Analysis
Dark Defender’s tweet provides further context to the chart analysis, focusing on the broader monthly timeframe. He noted that smaller timeframes might give “distracting signals,” while the larger view offers a clearer picture. The tweet underscores the importance of watching the intersection of support and resistance, as it marks the moment when “the $XRP run starts.”
This insight aligns with the chart’s depiction of a narrowing range, suggesting that once XRP breaks free from this zone, a strong move could follow. The tweet reinforces the idea that XRP’s potential bullish run will be realized if the price pushes above the cloud and continues upward.
Subscribe to our YouTube channel for daily crypto updates, market insights, and expert analysis.
We recommend eToro
Wide range of assets: cryptocurrencies alongside other investment products such as stocks and ETFs.
Copy trading: allows users to copy the trades of leading traders, for free.
User-friendly: eToro’s web-based platform and mobile app are user-friendly and easy to navigate.


