Ethereum is giving bulls a lot to work with. The ETH price climbed from around $1,900 to a local high of $2,547. Big volume behind it, whales accumulating, and more ETH leaving exchanges.
But there’s still a big wall ahead. ETH is testing $2,500 right now, and the real resistance sits between $2,722 and $2,970. If buyers can crack that zone, then the path to $5,000 starts to look a whole lot more interesting.
Read Also: Here’s Why the Crypto Market Is Up as Bitcoin and Ethereum Pump
What you'll learn 👉
Ethereum Price Breaks Out From Its Consolidation Range
We had a look at the ETH chart, and the recent change in price action stands out. Between August 6 and August 19, Ethereum traded in a relatively tight range between $1,700 and $2,000, with trading activity remaining subdued.
That changed around August 20. Large green candles pushed the Ethereum price through $2,100 and $2,300 before ETH reached approximately $2,500. The move did not continue without resistance. Sellers pushed ETH back toward $2,400, but buyers stepped in and recovered the price to around $2,462.
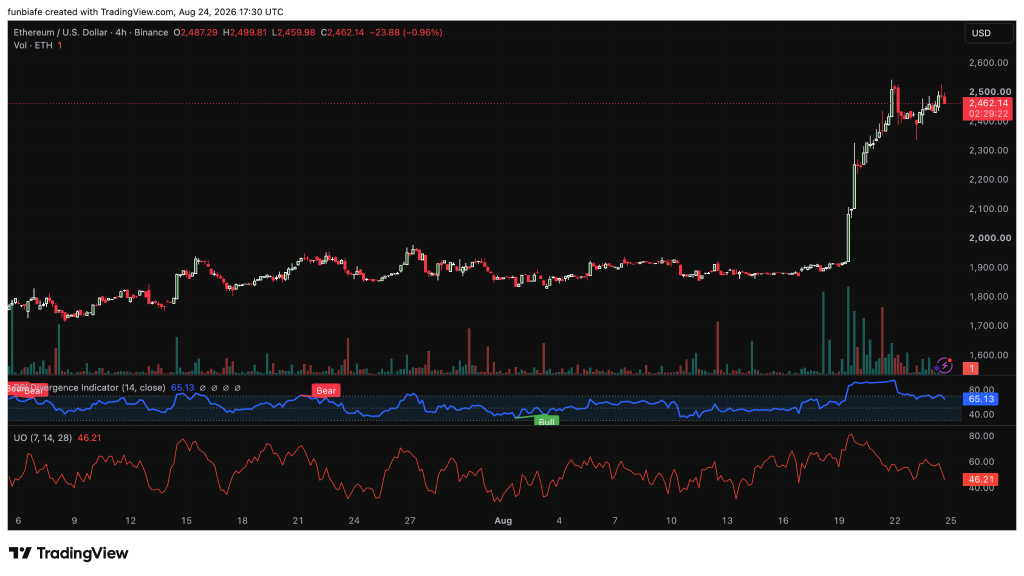
Trading volume also expanded during the move. The large volume bars between August 20 and August 24 were much higher than those recorded during the earlier consolidation, giving the breakout stronger confirmation.
The indicators, however, are starting to cool. RSI is at 65.13, which remains bullish but is still below the 70 overbought threshold. The Ultimate Oscillator is at 46.21, below the neutral 50 level, showing that short-term momentum has weakened after the rejection near $2,500.
Whale Activity Supports the Ethereum Price
The on-chain data adds an interesting piece to the Ethereum price setup. Ali Martinez reported that addresses holding more than 10,000 ETH increased by 1.74%, with 17 new whale addresses appearing over the past week.
COULD ETHEREUM HIT $5,000?
— Ali Charts (@alicharts) August 23, 2026
1/7 🧵👇
That points to increased accumulation among large holders. ETH exchange balances have also moved lower. More than 180,764 ETH, worth approximately $440 million, left exchanges over the same period. MVRV data provides another bullish signal.
On August 19, Ethereum’s MVRV Ratio crossed above its 160-day moving average. That’s a golden cross. Since then, ETH ran from $1,905 to $2,547. That’s a 34% gain. Does that mean it’s going to keep running? Not necessarily. But it does give this recovery a little more weight behind it. On-chain data backing up the move is always nice to see.
Read Also: SUI Price Prediction as Phantom Ends Support Amid 82% TVL Crash
Can ETH Really Reach $5,000?
The road to $5,000 runs through a major resistance zone between $2,722 and $2,970. URPD data shows 16.70 million ETH were bought in that range. That’s a lot of supply sitting there, waiting to sell if the price comes back. If ETH clears $2,970 with strong volume, things get interesting. Ali Martinez pointed out an MVRV pricing band near $5,363 at the 2.4 MVRV level, so $5,000 fits within that wider range.
But don’t ignore the downside. A rejection at $2,500 could send the ETH price back to $2,300. That’s the key near-term support. Below that, the Realized Price sits around $2,235. Holding above $2,300 keeps the bullish setup intact. A clean break below would weaken it. So can ETH hit $5,000? Yeah, it’s possible. But there’s a lot of work to do before that becomes real. Clearing $2,500 and then breaking through $2,722-$2,970 would be the key confirmation that buyers are ready to take the next leg higher.
FAQs
Subscribe to our YouTube channel for daily crypto updates, market insights, and expert analysis.