In today’s altcoin market update, we will take a look at AAVE, ADA, MATIC and LTC price actions.
What you'll learn 👉
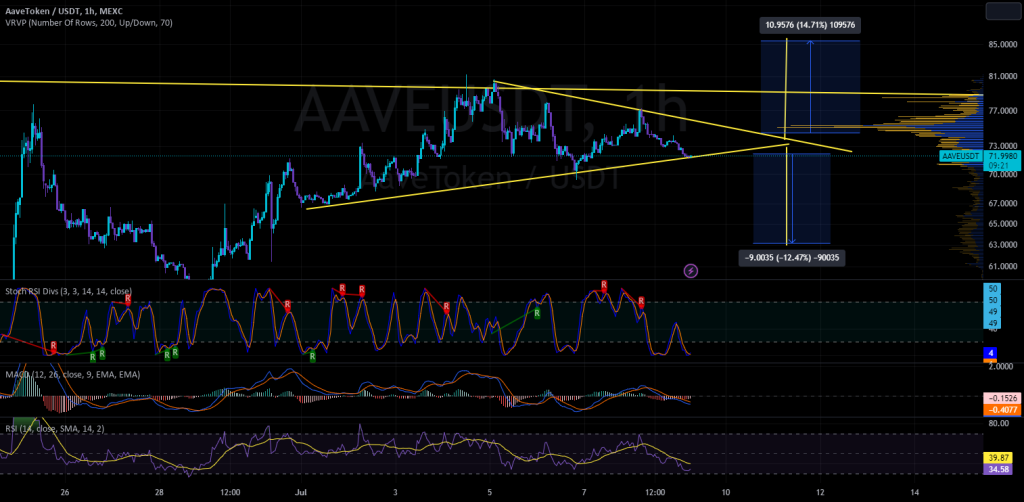
AAVE: A Potential Breakout on the Horizon
The chart of AAVE reveals a symmetrical triangle formation, a classic pattern that often precedes a significant price move. At present, AAVE is testing the lower leg of the triangle. Symmetrical triangles typically offer a 50/50 chance of breaking either up or down. However, a broader perspective is gained by zooming out to the daily time frame.
Upon examining the daily time frame, AAVE is observed within a descending triangle formation. This pattern often leans towards a downside breakout. Adding to this bias, the stochastic RSI and the MACD are both trending downwards. Considering the broader context, there’s a higher probability for the triangle to break to the downside due to the daily time frame’s descending triangle pattern. The measured move for an upside breakout is approximately 15%, while a downside move could reach around 12%.
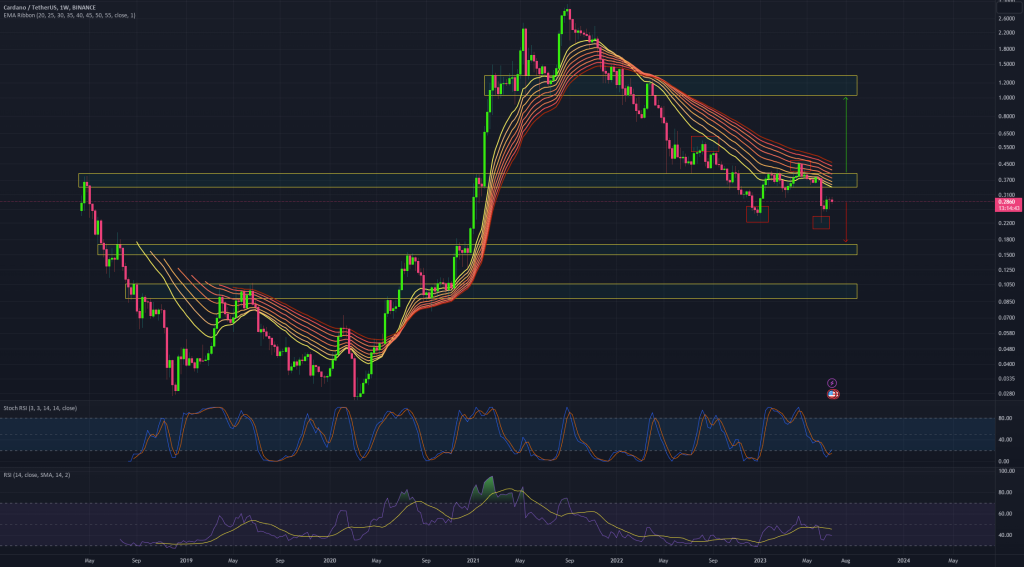
ADA: More Downside Potential?
The ADA chart raises the question of whether ADA still has the possibility of more downside. Previous trading ranges of interest are highlighted in the boxes. The red boxes highlight the fact that ADA has not made a higher high or higher low as of yet. Some bullish divergence is observed on the RSI, but this hasn’t been confirmed yet. Looking to the past, the previous trading area of strength is indicated by the red arrow. It is possible ADA might head down there to pick up more liquidity before making any impressive gains.
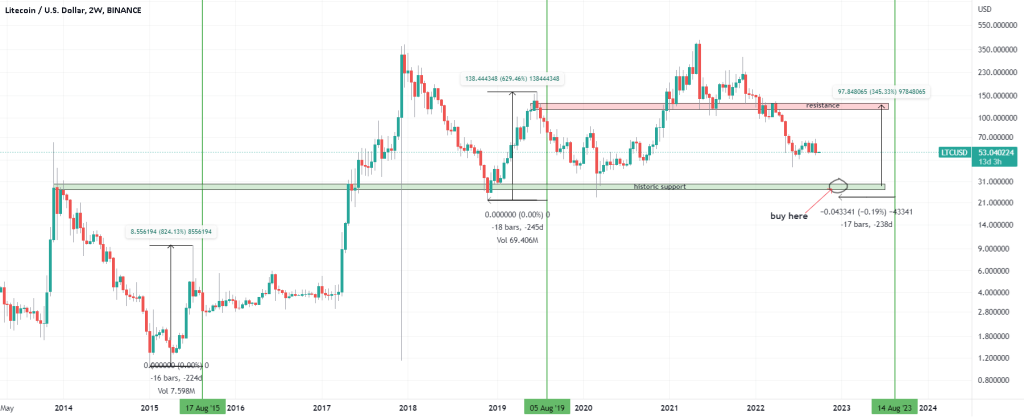
LTC: A Pattern Around Halving Events
The LTC chart suggests a pattern related to its halving events. The first LTC bottom took place 224 days before its first halving, and it pumped ~800%. It topped out around 40 days before the halving, and subsequently dropped around ~75% in the months that followed. The second bottom took place 245 days before its second halving and it pumped ~600%. Once again, it topped out around 40 days before the halving, and subsequently dropped around 85% in the months that followed. If this pattern plays out a third time, LTC will reach its bottom around ~235 days before its next halving, some time in late December of 2022 and early January of 2023.
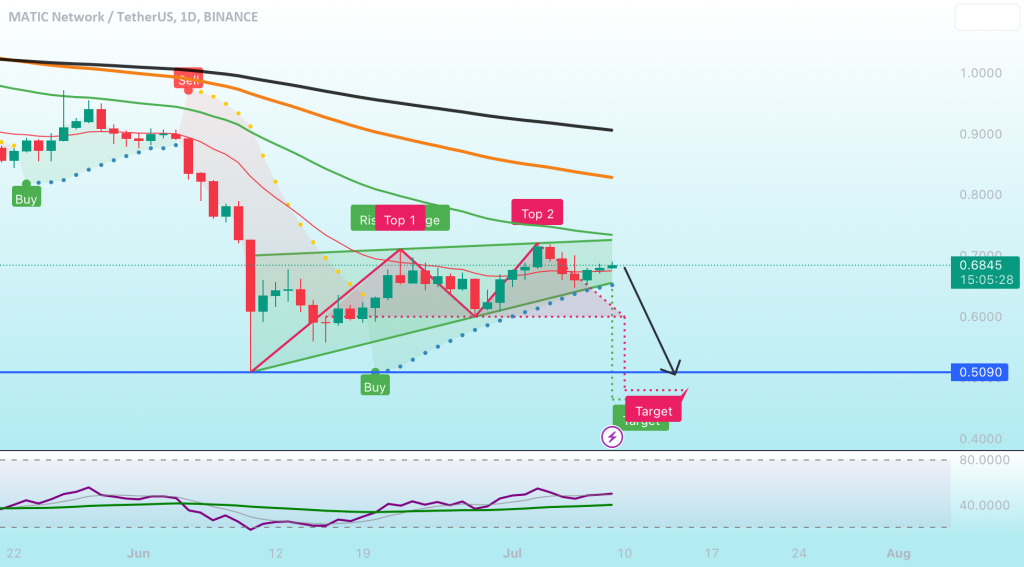
MATIC: A Cautionary Tale
The MATIC chart shows a rising wedge, a double top, and a potential double bottom. The growth of BTC dominance and a possible correction in BTC could lead MATIC to reach a goal in the region of $0.5.
In conclusion, the cryptocurrency market continues to offer a thrilling roller coaster ride for those who dare to hop on. As always, it’s crucial to stay updated with the latest chart patterns and market trends to make informed trading decisions. Stay tuned for more updates and happy trading!