
Yesterday we saw the crypto markets recover in a decent fashion after suffering a rather bloody Monday, one of the bloodiest in the history of crypto. BTC dropped all the way down to 5,800 USD and then bounced back to almost 6,600 USD in just over a day, leading us on a pretty wild rollercoaster ride. The king of the market seems hell-bent on staying within the 6000-6500 USD zone for now (support/resistance levels for now), with no clear indications where it wants to go next.
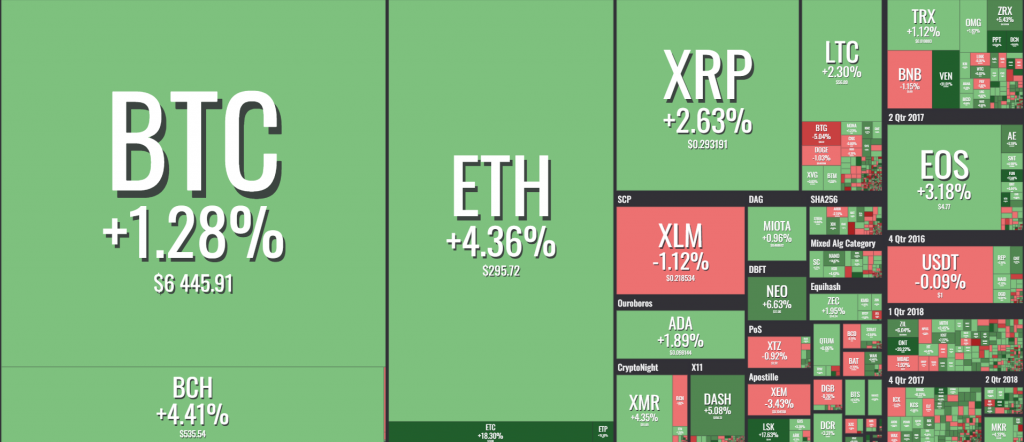
Let’s take a look at what major traders had to say about today’s picture:
Bitcoin (BTC)
Turningmecard from TradingView thinks it could be a good idea to short BTC at the moment:
“Guys! BTC is moving. For the last hours it has consolidated at 62, 63 levels. It might have a chance to make a higher high than 6640. Going long is risky, but if you can at lower 63 level try. I would wait for shorting. From 6580/6640/6740/6810 can be an open spot. The indicators tell that this challenge can be possible, even though now it seems not convincing. So just in case, open shorts, if it comes we buy, if not no buy. And after this can go all the way down!”
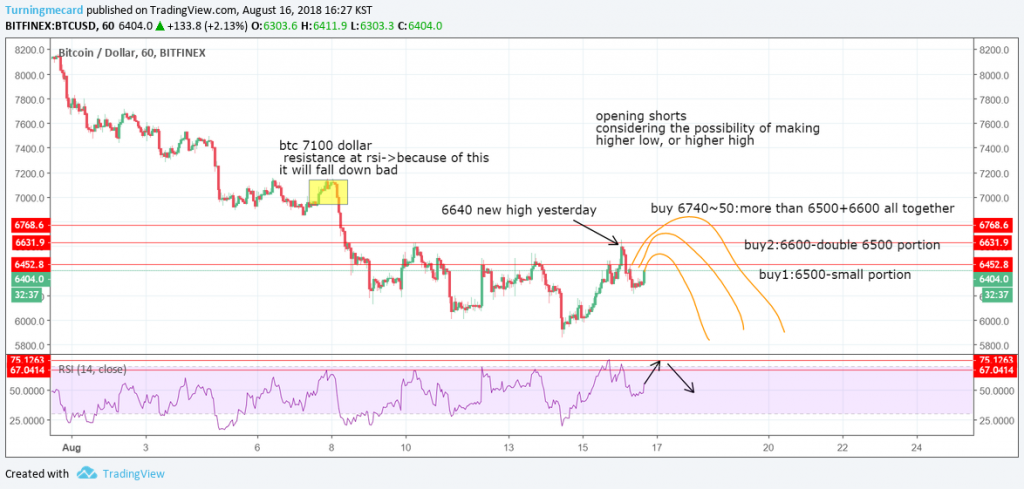
He further expands on his call:
“If the bulls break this 64 resistance, and 6470, it can go straight to 65, or 66 like yesterday. They have very little time now to break that, because 4hr ichimoku clouds are pushing them out so hard now. Let’s see if they can break it.”
Check out his complete analysis of the last couple of days and why he feels this was a false BTC breakout here. On Twitter, @CryptoDonAlt had some slightly more bullish views:
$BTC small timeframe rage update:
Still ranging.
I don't really see the 6600 resistance holding after having been tested 4 times already.S: 6350
R: 6800.Aiming to add at 6350 if we get there again, if not free riding this.
We finished shaking out the overleveraged. pic.twitter.com/xPkBclI9Qp— DonAlt (@CryptoDonAlt) August 16, 2018
alanmasters confirms that the general sentiment should be bullish and lists the following signals as the reason for that:
- Huge volume
- SHORTS near all-time high (last time this happened Bitcoin went up in price)
- MACD accumulation spotted and higher lows. Long term bullish divergence continues building up
- RSI touched low point of 28 and now curving up. Showing plenty of room available for growth while sitting near bottom
- Bullish candlesticks the last two days
- $5700 – $6000 support level has been holding since Mid-October 2017.
He concludes: “These are just a few of the signals that I am getting from my charts. Some of these are early signals, others are strong. One thing that we can be for sure is that Bitcoin is closer to the bottom than to its top.”
Ethereum (ETH)
For Ethereum, we checked out the thoughts of one TradingView veteran. The veteran is TheChartGuys account, which posted the following analysis:
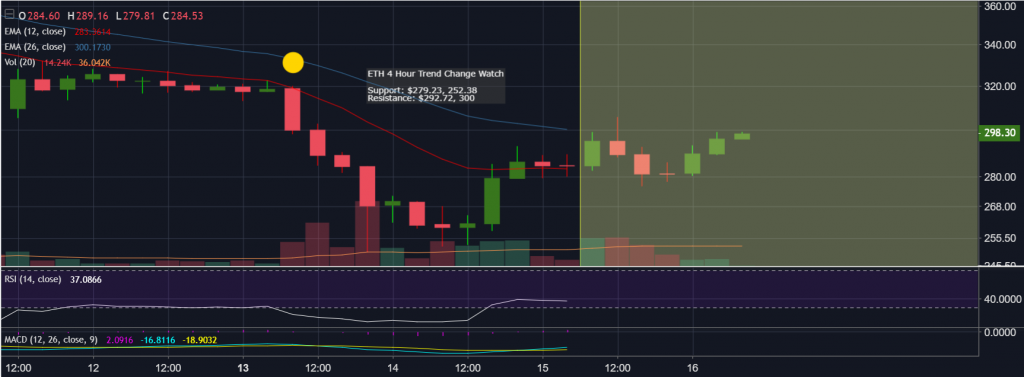
“Healthy low volume consolidation as the bulls look to form a 4 hour higher low. From there bulls will need confirmation of the trend change with a higher high. BTC is potentially facing a short squeeze which would be a big boost to ETH daily oversold bounce.”
After confirming that the trader who did the analysis exited his position from 2 days ago in the $280s, the account described his plans for the future:
“We need a clear low, and bounce from that level to establish a clear stop level to use. Bears are looking to enter when bulls get extended, but those who understand trading and markets are not as comfortable as they were yesterday with the potential squeeze.”
They further posted a follow-up, explaining why their trader decided to stay in cash for now.
Ripple (XRP)
As for XRP, traders feel it’s in for some bullish movements as well, as they noticed several bullish patterns on its graph. Yo_adriiiiaan for example noticed the hammer candle pattern and a very oversold RSI. Eurocrem noticed a cup and handle formation on the daily:
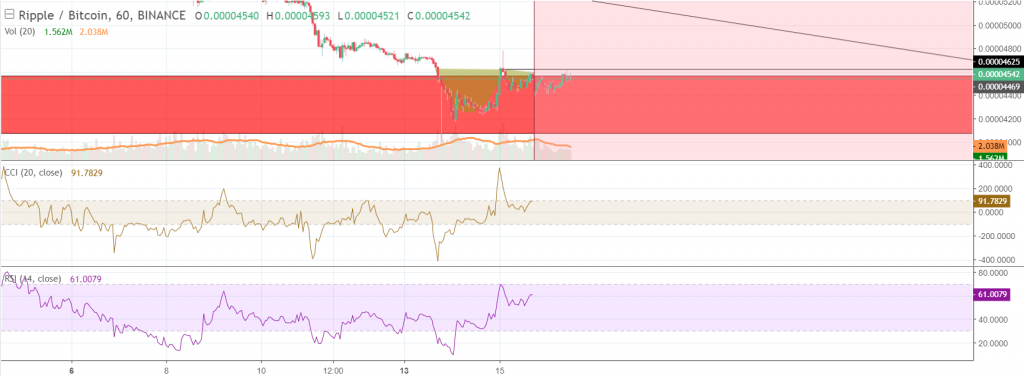
“Daily chart: XRP hits red zone target. Rejected nicely and making its way out.
Hourly chart: Cup formed, handle on its way forming.
Prediction: if handle breaks past ~4700 satoshis, looking for the target to be atleast 5400 satoshis…if price breaks past trendline , then we move onto the next zone and next trendline ….if that breaks, then the bull run might be coming. I don’t think that will happen just yet, though….we need one more correction.”
Other highlights
Other market alts preformed pretty much similarly, looking to find zones to bounce from. One of better movers was BAT, which managed to reach 20% gains yesterday before dropping back into the pictured buy zone. ForecastCity explains the situation in detail:
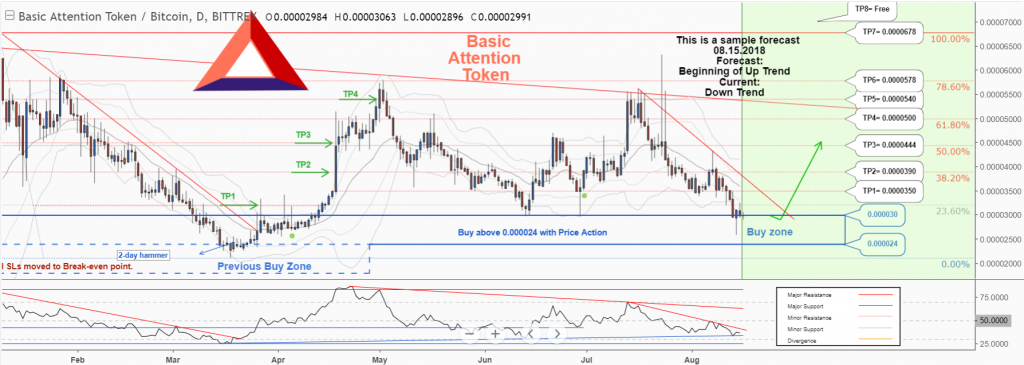
BasicAttentionToken/Bitcoin is in a Down Trend and the beginning of uptrend is expected. The price is below the 21-Day WEMA which acts as a dynamic resistance. The RSI is at 37. While the RSI and the price downtrend in the daily chart are not broken, bearish wave in price would continue.There is a possibility of temporary retracement to the new suggested support zone(0.000030 to 0.000024). if so, traders can set orders based on Price Action and expect to reach short-term targets.
Other notable performer was ETC, which managed to break out significantly on the back of the recent Coinbase announcement. However cryptogast33 wasn’t impressed:
“Everytime there is a coinbase tweet, it’s already pumped 30 seconds in ADVANCE with f*cking IRRELEVANT news. Inside trading much? Combine that with a sh*tty exchange somewhere who lags 5-10 seconds on trade execution with tons of errors and getting stopped out on the exact 0.001 point, what more can go wrong with this sh*t crypto. Wait until those clowns are done with pumping then short this garbage with has 0 functionality other than exchange owners loving this piece of sh*t and happily trade against you when their bots stop you out.”


