An ounce of gold averaged $761 in November 2008. By September 2011, the monthly average had reached $1,772. That 133% gain is why Casey Donaldson thinks gold investors should take another look at the financial crisis before deciding what to make of this gold crash. One detail worth remembering: buyers who caught the low waited almost three years for that return.
Donaldson puts the latest decline at around 30%, compared with nearly 35% in 2008. His chart tells the story on a different basis. It uses monthly average prices from the World Bank’s Pink Sheet, which smooth out the highs and lows within each month. On that measure, gold fell 21% from March to November 2008. The October 2026 average was 18% below the February peak. October is where the blue line ends, so it leaves out November’s selling.
Gold’s 2026 Pullback Followed a Much Faster Rally
The most interesting part of Donaldson’s chart comes before either selloff. Gold rose about 53% in the 14 months from January 2007 to March 2008. Starting in January 2025, it gained roughly 85% in just 13 months. The two declines look similar on the page, but buyers entered them with very different gains.
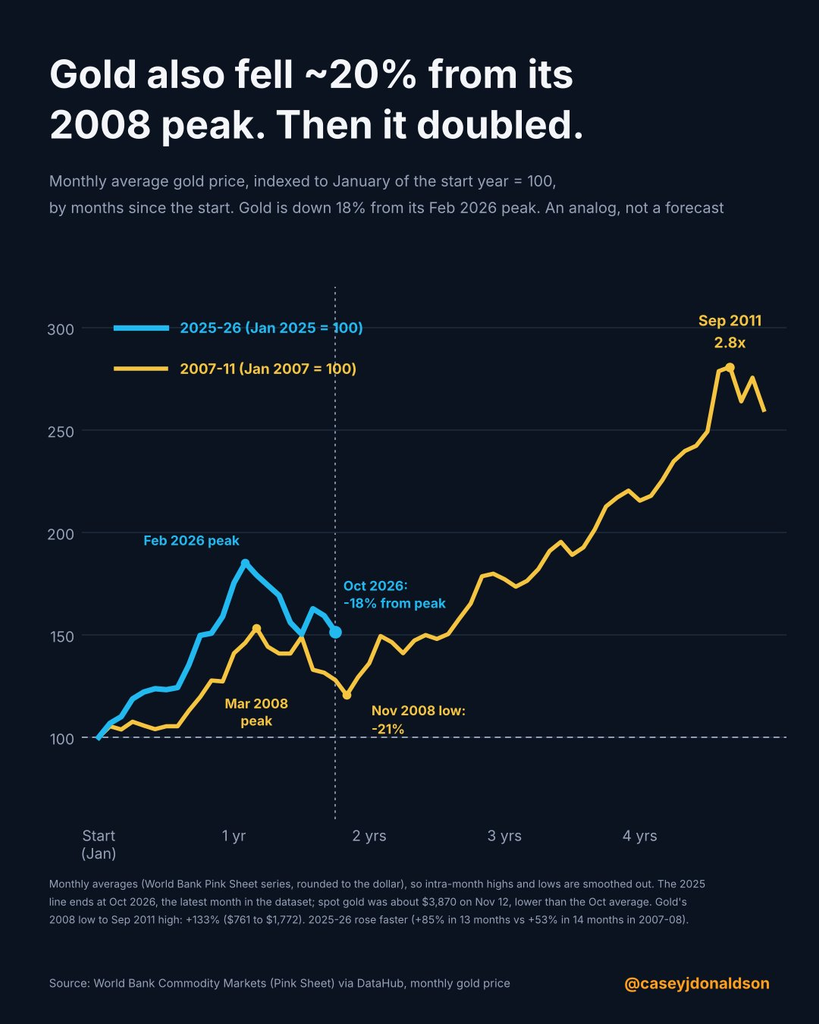
Set each January starting price at 100, as Donaldson does, and the difference is easy to see. The older rally peaked around 153 and fell to roughly 121. The latest rally reached about 185 and was still near 152 in October. In other words, even after eight months of losses from its February peak, gold had kept a gain of roughly 52% from January 2025. That was about as much as the entire run-up to the March 2008 high.
Read also: Gold Price Today: Why Gold Has Crashed 30% Despite Heavy Central Bank Buying
What the 2008 Gold Chart Says About a Possible Bottom
The timing gives Donaldson’s comparison some weight. Eight months separated the March 2008 peak from the November low. Eight months also separated the February 2026 peak from the last monthly average in his chart. But Donaldson’s own footnote puts spot gold near $3,870 on November 12, already below the October average. A buyer using the eight-month pattern to call a bottom still had to contend with a falling price.
Donaldson also points to central-bank buying, inflation and government debt as reasons to expect another long rally. Those are separate arguments. The chart tracks the price of gold and gives no measure of how much central banks bought during either decline.
Our read is that 2008 makes a good case for keeping a long-term recovery on the table. It offers much less help picking the week to buy. The old rally became convincing when gold recovered its March 2008 peak and kept going. For this cycle, a monthly average back above the February 2026 high would make the comparison far more persuasive than two pullbacks of similar length.
Subscribe to our YouTube channel for daily crypto updates, market insights, and expert analysis.