
XRP price crashing below $1 looks disastrous on a short-term chart.
Zoom out to the weekly timeframe, however, and Charting Guy sees something completely different: a structure that looks remarkably similar to the process that preceded XRP’s last large recovery.
His latest XRP chart compares the 2021-2022 decline with the correction unfolding today. Both periods contain an A-B-C decline, a long descending resistance line and, most importantly, a bullish divergence on weekly RSI.
Charting Guy believes XRP is forming a Wyckoff-style reaccumulation structure and maintains a minimum XRP price target of $4.36.
If his comparison is right, the recent drop below $1 could belong to a bottoming process instead of marking the start of another long decline.
What you'll learn 👉
XRP Price Is Repeating Several Features From 2022
The left side of Charting Guy’s chart shows XRP after its 2021 peak.
Price formed an initial low labeled A, recovered into a lower high at B, and then eventually printed a deeper C low in 2022.
Yet something different was happening underneath price.
As XRP made that final lower low, weekly RSI formed a higher low.
That bullish divergence indicated that price was deteriorating faster than momentum.
XRP then spent months basing before eventually moving dramatically higher.
Charting Guy sees a similar pattern now.
Following the 2025 peak, XRP dropped into an A low, recovered toward B and has since spent more than a year moving underneath descending resistance toward another C-type low.
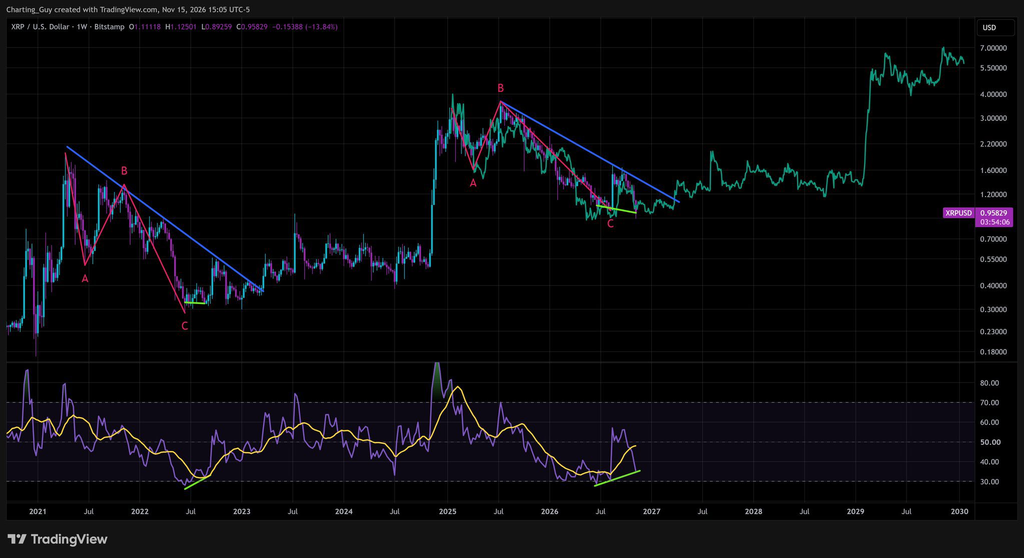
The latest XRP price drop briefly took the token below $0.90 before it recovered to around $0.96. XRP is down roughly 14% over seven days and 26% over 30 days.
Yet weekly RSI is again refusing to confirm the new price low.
That is the part of the chart Charting Guy finds most compelling.
Bullish XRP RSI Divergence Is Developing
A bullish divergence occurs when price makes a lower low but an oscillator such as RSI creates a higher low.
It does not mean price must immediately reverse.
It tells us that downside momentum is weakening relative to the price decline.
Charting Guy’s chart shows this occurring near the end of the 2022 correction and potentially happening again now.
There is another interesting similarity.
In both cases, the final part of the decline developed underneath a long descending trendline before price eventually had an opportunity to reverse the broader structure.
The current setup is therefore less about calling $0.90 the exact bottom and more about asking if XRP has reached the exhaustion stage of its long correction.
Why Charting Guy Still Targets $4.36
Charting Guy says his minimum XRP price target remains $4.36.
From roughly $0.96 today, reaching $4.36 would require a gain of approximately 354%.
It would also take XRP above its current all-time-high region.
The projected path on his chart does not show that happening immediately.
It first depicts XRP spending time recovering and consolidating before eventually moving substantially higher, similar to the long accumulation phase that followed the previous cycle low.
That distinction is important.
The argument is not that bullish RSI divergence suddenly sends XRP to $4.36. The thesis depends on the divergence developing into an actual long-term reversal.
Read also: Bitcoin and XRP Leverage Is Being Flushed: Is a Bottom Getting Closer?
Our Take: The Divergence Is Interesting, but Price Confirmation Is Missing
I think the historical comparison is genuinely worth watching.
XRP is now deeply depressed, funding is negative and the token recently traded as low as roughly $0.89. CoinGecko data also shows XRP underperforming the broader crypto market over the past week.
That is exactly the kind of environment where meaningful bottoms can eventually form.
But bullish divergence alone is insufficient.
XRP first needs to prove that sellers cannot keep pushing price lower. Recovering $1 would be the first small step. Getting back above roughly $1.10-$1.20 would make the idea considerably more convincing.
The $4.36 target is therefore far from confirmed.
For more crypto news and price predictions, click here.
Subscribe to our YouTube channel for daily crypto updates, market insights, and expert analysis.