Kaspa price has been hit hard by the broader crypto selloff, and lost roughly 8.5% over the past week and falling back toward $0.029.
That decline has pushed KAS directly into a technical area that More Crypto Online believes could decide the next major move.
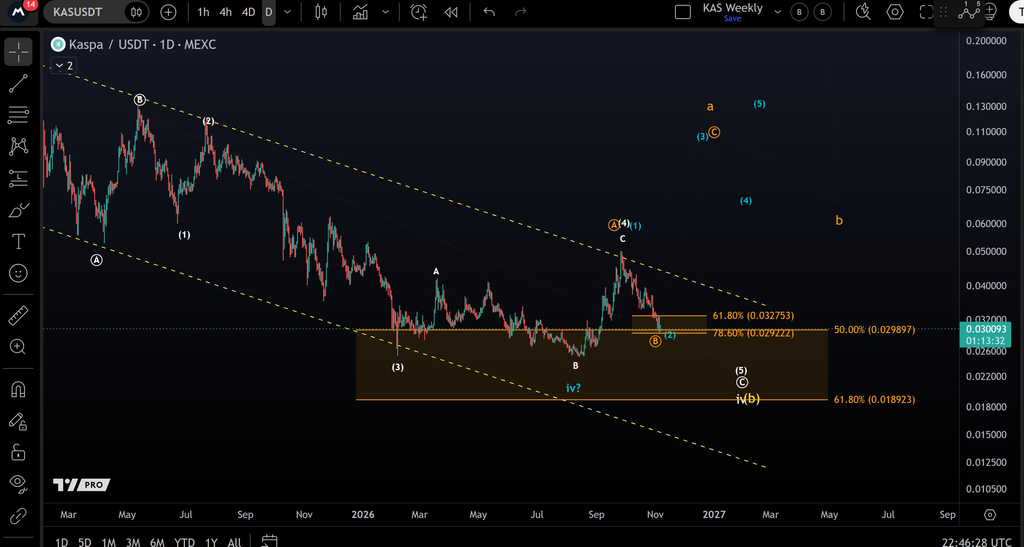
The analyst says Kaspa is now testing the 78.6% Fibonacci retracement of its latest rally. If buyers fail to defend this zone, the probability of another low increases.
What you'll learn 👉
$0.029 Is the Immediate Kaspa Battleground
More Crypto Online’s daily chart places the 78.6% Fibonacci retracement around $0.0292.
That is almost exactly where KAS is trading now.
Just above it sits the 50% retracement near $0.0299, while the 61.8% level is around $0.0328.
The clustering of these levels means the current $0.029-$0.033 area is more than ordinary support.
It is the zone where the recent bullish recovery either begins to prove itself or starts losing credibility.
KAS briefly rallied toward $0.048-$0.050 during the previous move, but sellers quickly pushed price back toward the base of that advance.
The depth of the retracement is the warning sign.
When price gives back almost 80% of a rally, bulls are running out of room.
Read also: Kaspa Whales and Exchanges Hold Nearly 45% of Circulating Supply
What Happens If $0.029 Fails?
The white Elliott Wave scenario on the chart shows a considerably deeper correction.
If the Kaspa price cannot establish support around the current 78.6% retracement, More Crypto Online’s alternative count leaves room for another low.
The most important downside level on the chart sits around $0.0189, corresponding with a larger 61.8% retracement.
From approximately $0.029, a move to $0.0189 would represent another decline of roughly 35%.
That does not make $0.019 an automatic target.
The analyst’s point is that failure at the current support would make that bearish scenario increasingly plausible.
Kaspa Price Forecast: Bulls Still Have a Path Back
The chart is not completely bearish.
More Crypto Online also maps a bullish scenario where the current decline finishes around this zone and develops into a much larger advance.
But KAS needs to prove that first.
The initial signal would be holding roughly $0.029 and recovering above $0.032-$0.033.
That would put price back above the nearby Fibonacci cluster and show that buyers are absorbing the market-wide selling pressure.
Beyond that, the previous local high around $0.048-$0.050 would become the next important test.
For now, though, the focus is lower.
Kaspa has already lost around 8.5% this week, and the broader crypto market remains fragile.
At approximately $0.029, bulls are now defending one of the last major Fibonacci levels from the previous rally.
If they fail here, the chart leaves considerably more downside on the table.
Subscribe to our YouTube channel for daily crypto updates, market insights, and expert analysis.