
Gold and silver are heading into October 21 after another uneven session across precious metals.
Gold spent October 20 under pressure and was trading near $4,128 on the latest four-hour chart. Several attempts to recover toward $4,180-$4,200 have failed, and price has drifted back toward the lower half of its recent range.
Silver performed better. XAG/USD recovered to roughly $57.82 after recently falling into the $55-$56 area. Buyers have managed to keep the rebound alive, but silver still has plenty of technical damage to repair before the larger decline can be called over.
The difference between the two charts is interesting. Gold is losing short-term momentum again, whereas silver’s RSI has finally moved back above 50.
What you'll learn 👉
Gold Chart Analysis: $4,100 Is Back in Focus
I analyzed the Gold Spot/U.S. Dollar four-hour chart from October 20, with price near $4,127.70.
Gold has been unable to build on any of its recent rebounds. Since the late-September drop, most attempts toward $4,180-$4,200 have stalled, leaving a broad sideways structure between approximately $4,080 and $4,200.
The latest RSI reading is around 43.2, below its moving average near 48.
That gives sellers a short-term momentum advantage, but gold is not oversold. There is still room for price to move lower before RSI reaches an extreme.
The first area I am watching is $4,110-$4,100.
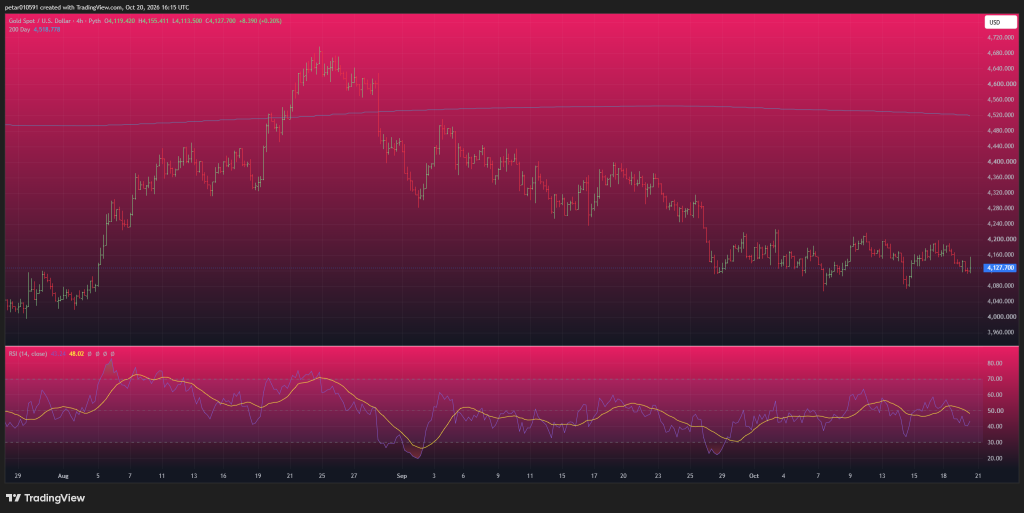
Gold has reacted around that region several times. Losing it would expose the recent lows around $4,075-$4,080, followed by approximately $4,040.
The upside picture begins improving around $4,160-$4,180. Above there, $4,200-$4,220 remains the harder ceiling that bulls have repeatedly failed to overcome.
The 200-day average near $4,519 is still far above current price, showing how much damage the broader trend has absorbed since the summer peak.
Read also: ChatGPT Predicts Where Gold Price Could by the End of 2026
Silver Chart Analysis: Momentum Is Finally Improving
Silver looks more constructive on the same four-hour timeframe.
XAG/USD was near $57.82 at the latest candle after recovering from the recent low around $55.50.
The RSI reading has moved to roughly 52, compared with an RSI average near 44.6. That is a notable change because momentum has finally moved slightly above neutral after spending much of the recent decline below 50.
I would still hesitate to call it a reversal.
Silver remains inside a broader structure of lower highs dating back to the September region around $69-$70.
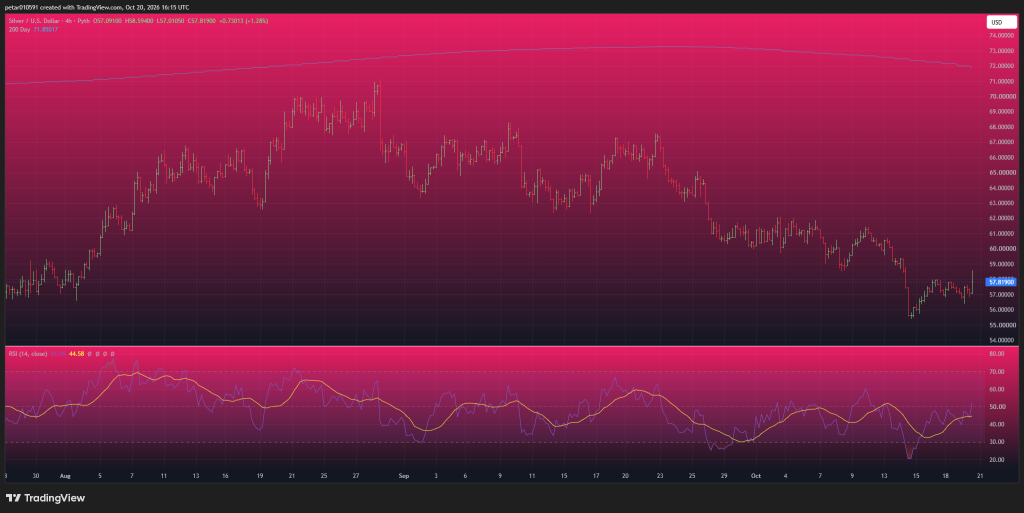
The immediate challenge is $58-$59.
If buyers can establish price above that area, $60 becomes the next obvious target. Beyond $60, I would watch approximately $61-$62, where previous consolidation took place.
On the downside, $57 is the first area that needs to survive. A return below that level would weaken the latest bounce and put $56-$55.50 back into play.
The 200-day average is around $71.85, so the long-term recovery remains a distant task.
Read also: This Silver Price Prediction Is Almost Impossible to Believe
Macro News That Could Affect Gold and Silver
Monetary policy remains the dominant theme.
Gold traded near $4,139 during October 20 as investors waited for clearer signals from the Federal Reserve. Markets currently expect the Fed to leave rates unchanged at its October 27-28 meeting, but traders are assigning a very high chance to another increase in December. Persistent inflation remains the reason that possibility has not disappeared.
Treasury yields have offered some relief. Weak U.S. housing data pushed the 10-year yield toward roughly 5.08% after its recent spike above 5.3%. Housing starts reportedly fell 5.2%, and pending home sales dropped 7.3%. Falling yields are normally supportive for gold and silver because they reduce the relative appeal of interest-bearing assets.
But the bond market remains complicated. The recent selloff has been linked to persistent inflation, energy pressures and a more restrictive Fed stance. Real yields have been particularly important for precious metals because higher inflation-adjusted returns can pressure non-yielding assets even when headline inflation remains elevated.
Silver has an additional problem: economic sensitivity. Concerns about global growth and industrial demand can pressure XAG even if lower yields are helping precious metals generally.
That combination explains why gold and silver can sometimes react differently to exactly the same macro news.
Gold and Silver Price Predictions for October 21
For October 21, I would frame the setup around these levels rather than one exact target.
| Metal | Constructive scenario | Likely trading zone | Bearish scenario |
|---|---|---|---|
| Gold | Reclaim $4,160-$4,180 → $4,200-$4,220 | $4,100-$4,180 | Lose $4,100 → $4,075, then $4,040 |
| Silver | Hold $57 and clear $58-$59 → $60-$61 | $56.50-$59 | Lose $56.50 → $55.50, then $54 |
For gold, my bias for October 21 is neutral-to-bearish unless price can recover $4,160-$4,180. RSI below 50 and repeated rejection from higher levels keep $4,100 vulnerable.
Silver looks somewhat better. RSI has recovered above 50, and the bounce from $55.50 has held for several sessions. A move through $58-$59 could turn that improvement into a more convincing recovery toward $60.
If I had to choose the two prices that decide Tuesday’s setup, they would be $4,100 for gold and $57 for silver.
Hold those levels and both metals retain room to rebound. Lose them, and the recent lows become vulnerable again.
For more financial news and price predictions, click here.
Subscribe to our YouTube channel for daily crypto updates, market insights, and expert analysis.