XRP price enters October 14 trading around $1.366 after rebounding from a recent low at $1.3103.
The short-term setup is improving, but the recovery is not confirmed yet. Based on the Binance XRP/USDT two-hour chart I analyzed, XRP needs to reclaim $1.38 first and then $1.40-$1.42 before the structure starts looking stronger.
This analysis uses the latest visible candle and indicator readings shown on the mentioned two-hour chart.
What you'll learn 👉
XRP Chart Analysis
XRP has been trending lower from the $1.50-$1.55 area and recently dropped to $1.3103 before buyers stepped in.
That low now acts as the clearest support visible on the chart.
Our interpretation of the supplied chart puts immediate support around $1.34-$1.35. If buyers keep defending that zone, XRP has room to attempt another move toward $1.38 and then $1.40-$1.42.
The $1.40-$1.42 region is important because price previously traded around that area before the latest decline. A recovery through it would strengthen the case for a move toward $1.45.
On the downside, a loss of $1.34-$1.35 would put $1.31-$1.32 back in focus.
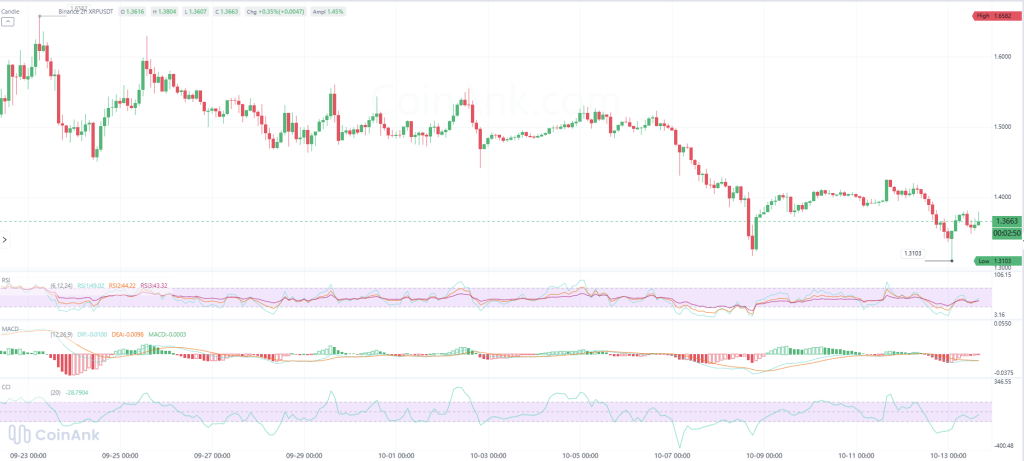
A sustained move below $1.3103 would invalidate the current rebound setup and expose $1.30.
What the XRP Indicators Show
The RSI readings are recovering, but they are not fully bullish yet.
The chart shows:
- Short RSI near 49.0
- Medium RSI near 44.2
- Longer RSI near 43.5
That puts the shortest reading close to neutral, with the longer readings still below 50.
MACD is also close to neutral but remains slightly negative.
Visible values on the chart are:
- DIF: about -0.0100
- DEA: about -0.0098
- Histogram: about -0.0003
The gap is small, which tells us downside momentum has weakened compared with the earlier selloff. A bullish crossover would provide better confirmation that the rebound has more room to continue.
CCI is around -28.8, which places XRP below its recent average but far away from the deeply oversold readings seen during the drop toward $1.31.
Overall, the indicators point to stabilization, not yet a confirmed reversal.
Read also: $10,000 In XRP Today: Here’s Your Portfolio Value At Different Price Targets
XRP Price Prediction for October 14
These are conditional technical scenarios based on the supplied two-hour chart, not probability-weighted forecasts.
| Scenario | Confirmation | XRP price area |
|---|---|---|
| Bullish | Holds $1.35-$1.36 and clears $1.38 | $1.40-$1.42, then $1.45 |
| Neutral | Holds support but remains below $1.38-$1.40 | $1.34-$1.40 |
| Bearish | Loses $1.34-$1.35 | $1.31-$1.32, then $1.30 |
From the current $1.366 area, a move to $1.45 would represent roughly 6.1% upside.
A retest of $1.3103 would represent roughly 4.1% downside.
That gives XRP a fairly balanced short-term risk range, with $1.38 acting as the first upside confirmation level and $1.34-$1.35 as the first downside line to defend.
For October 14, the cleanest reading is simple: XRP is trying to stabilize, but the rebound needs $1.38 first and $1.40-$1.42 after that before buyers can claim stronger control.
For more crypto news and price predictions, click here.
Subscribe to our YouTube channel for daily crypto updates, market insights, and expert analysis.