
Bitcoin’s recovery from the $80,000 area has brought an old debate back into focus: how much can previous market cycles really tell us about the next correction? Analyst Killa, known as @KillaXBT, has challenged the use of historical chart patterns to predict where BTC must go next.
His argument raises a question that goes beyond whether Bitcoin price rises or falls today. A familiar chart pattern can look convincing, but the conditions behind that pattern may be very different. Killa believes those differences deserve more weight before anyone treats an old correction as a reliable guide.
What you'll learn 👉
Killa’s Bitcoin Price Warning Challenges Previous Cycle Comparisons
Killa’s criticism centers on cycle fractals, which are historical price patterns placed alongside current charts to identify possible similarities. These comparisons can help explain market behavior, but visual resemblance does not guarantee an identical outcome.
The analyst argues that Bitcoin has already departed from previous cycle behavior. His comparison puts the latest major decline at roughly 54%, versus drawdowns of around 77% to 80% in earlier cycles.
That difference matters because a smaller decline changes the scale of the recovery. Expecting the same correction depth without accounting for the earlier drawdown could produce unrealistic downside targets.
Killa also points to a recovery of roughly 50% of the preceding bear market decline. He describes that development as unusual compared with previous cycles. His post further references a move from $62,000 to $80,000 that he calls the largest short liquidation event.
Those observations form the basis of his argument. He believes Bitcoin price analysis needs to account for the current cycle’s behavior before borrowing expectations from an older chart.
A lot of people are posting previous cycle corrections as though Bitcoin is guaranteed to mirror them perfectly. That is a big mistake. This cycle is different, whether people like it or not. We have retraced roughly 50% of the entire bear market decline, something we have never seen before. Add in the largest short-liquidation event from 62K to 80K, and the context is completely different. You cannot compare cycles that saw 77–80% drawdowns and then expect the same depth of corrections now. We bottomed around -54%. That materially changes the scale of pullbacks we should expect throughout the bull market. The implication is simple: corrections are likely to be shallower than in previous cycles. Expecting identical downside because an old fractal looks similar is the same linear thinking that had people convinced Bitcoin would follow the exact same cycle pattern forever. I was one of the first to recognise that the cycles were speeding up, meaning an earlier bottom, and positioned accordingly. Posting a fractal without accounting for the wider context is narrow minded analysis. In 2023, BTC dropped 77%. During the recovery from 16K to 69K, the deepest correction was roughly 21%. This cycle, BTC only dropped 54%, around one third less severe. Applying that same logic, a 21% correction reduced by one-third would put the largest pullback closer to 14%. A 14% drop from the 87K highs puts $BTC almost precisely at 75K. And thats if we get the full blown corrrection from 87K. It could be from 95K down to 80K. It’s to soon to say. So even in a full-scale correction from here, we are only around 6% away from that level. Are you really willing to miss a potential 60% move higher because you are waiting for an extra 6% lower? I wouldn’t be. Larger capital clearly isn’t either. I still believe the 92-95K region is where we could see a more meaningful, broader correction, but it may simply take time to get there. For those still waiting on 70K: based on the maths, the context, and the way this cycle has behaved, there is a real chance we never see it again. Even another test of 75K would be a gift. You need to adjust your mindset if you expect corrections to mirror prior cycles. This cycle has already been structurally different from the moment it bottomed. This is Wall Street’s asset now.
— Killa (@KillaXBT) October 8, 2026
Killa’s Bitcoin Price Calculation Puts A Possible Pullback Near $75,000
Killa uses a previous recovery to illustrate his reasoning. His example describes a roughly 77% decline followed by a Bitcoin recovery from $16,000 to $69,000. He puts the deepest correction during that recovery at approximately 21%.
He then compares that decline with the roughly 54% drawdown he assigns to the current cycle. Since the newer decline was about 1/3 less severe, he reduces the previous 21% correction by approximately the same proportion.
That calculation produces a possible pullback of around 14%. Applied to an $87,000 high, it places Bitcoin price close to $75,000.
The main levels in his argument are:
- A 14% correction from $87,000 would bring Bitcoin close to $75,000.
- A later correction could begin near $95,000 and return toward $80,000.
- The $92,000 to $95,000 region remains his preferred area for a broader correction.
This is a proportional estimate, however, and price corrections do not have to scale directly with earlier bear market losses. The calculation explains Killa’s outlook, but it cannot establish a minimum price or a maximum correction.
Bitcoin Price Could Avoid $70,000, But Killa’s Outlook Remains Conditional
Killa believes there is a real possibility that Bitcoin never returns to $70,000. He also argues that waiting for another roughly 6% decline could mean missing a potential 60% move higher.
Those figures describe his view of the opportunity and downside risk. They remain hypothetical outcomes, rather than confirmed destinations for BTC.
His broader argument is that Bitcoin cycles have accelerated and that institutional participation has changed the market. He closes his post by describing Bitcoin as Wall Street’s asset.
Institutional participation is part of his explanation, but his post does not provide capital flow data to prove that larger investors share his specific targets. The useful distinction is between his market interpretation and evidence that can confirm it.
Bitcoin Price Outlook For Today Depends On $80,000 And $83,000
Our earlier article explained that Bitcoin price began recovering on Thursday evening after a decline toward $80,000. That rebound brought BTC closer to resistance around $83,000.
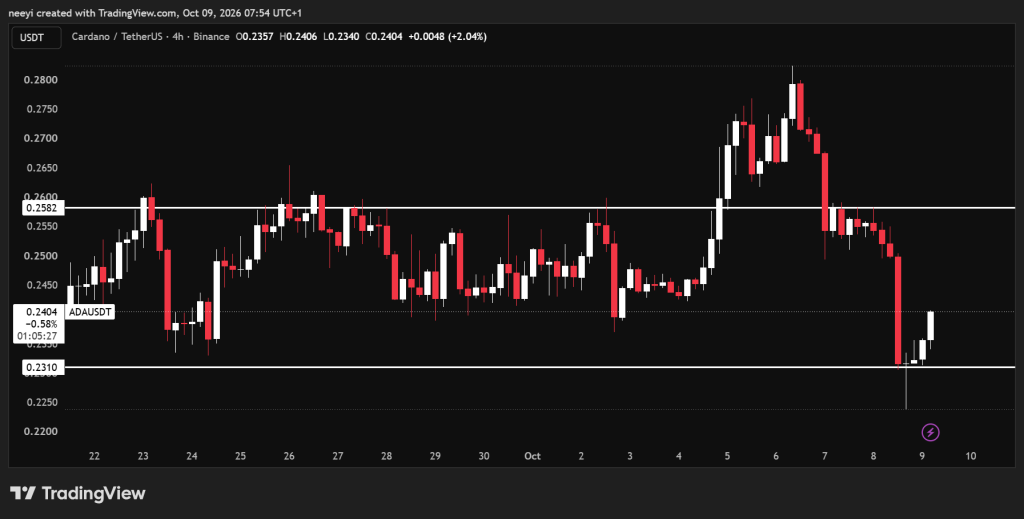
A look at the Bitcoin price levels shows a consolidation range between $80,000 and $83,000. These boundaries provide a more immediate test than Killa’s broader cycle projections.
The indicators supplied in that analysis still point to an incomplete recovery. Bitcoin’s RSI of 40.583 remains below 50, so momentum continues to favor sellers. The Stochastic reading of 48.769 offers limited directional confirmation.
The Ultimate Oscillator at 42.293 also remains below its neutral midpoint. Bull/Bear Power of negative 1,197.6041 indicates continued bearish pressure despite the rebound.
Read Also: Cardano and Ethereum Founders Clash Over AI and Crypto Security
Today’s Bitcoin price scenarios remain straightforward:
- Bullish Scenario: BTC holds above $83,000 and opens a possible route toward $85,000 to $86,000.
- Neutral Scenario: Bitcoin remains between $80,000 support and $83,000 resistance.
- Bearish Scenario: BTC loses $80,000 support and brings $78,000 into focus.
Killa’s warning gives readers a reason to question automatic comparisons with old cycles. Today’s price levels offer the next practical test: can Bitcoin turn its rebound into a sustained recovery, or will resistance force another visit to support?
Subscribe to our YouTube channel for daily crypto updates, market insights, and expert analysis.