Bitcoin may be building a structure that looks surprisingly similar to what happened after the 2022 bear-market bottom.
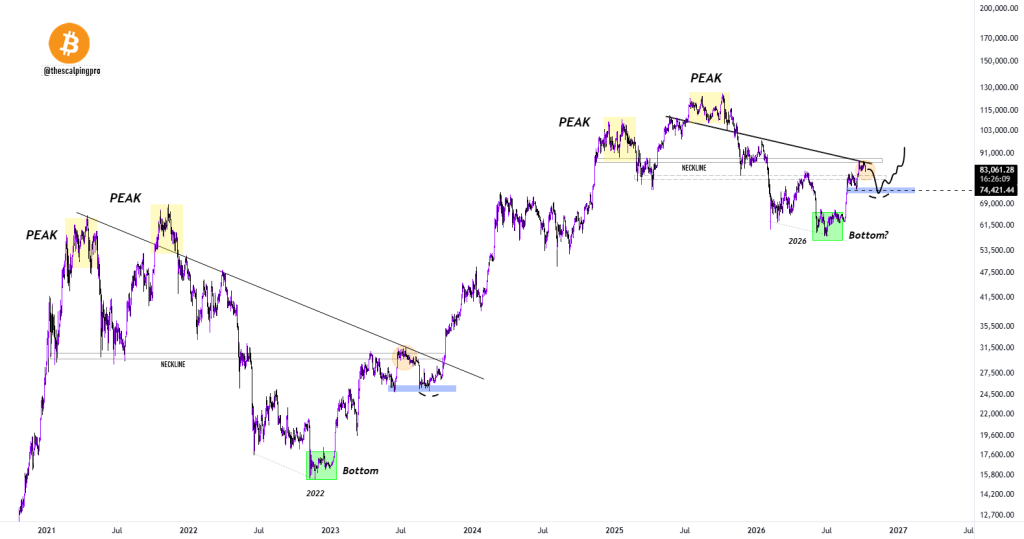
Popular crypto analyst Mags pointed out the resemblance in a new chart shared on X, comparing Bitcoin’s current recovery with the sequence that followed the 2022 low.
The two structures are not identical, but Mags believes the similarities are becoming difficult to ignore.
The biggest difference is speed.
The current pattern appears to be developing much faster than the previous cycle.
What you'll learn 👉
Mags Sees the Same Basic Bitcoin Sequence
Mags breaks the older cycle into several stages.
Bitcoin first formed a major bottom in late 2022.
Price then recovered aggressively, moved back toward a previous neckline, and failed to move through it on the first attempt.
BTC spent additional time consolidating underneath that area before eventually pushing through the neckline and the long-term falling trendline.
That move helped open the next major phase of the cycle.
Mags sees a similar sequence developing now.
Bitcoin appears to have formed a potential 2026 bottom, recovered strongly, and moved back toward another important neckline.
The question is whether the current rejection becomes another temporary setback before price eventually moves higher.
The Current Bitcoin Fractal Is Moving Faster
The most interesting difference is timing.
The 2022 structure took much longer to develop.
Bitcoin spent months recovering from the bottom, testing resistance, consolidating, and eventually moving through the major trendline.
The current version is moving through those stages much more quickly.
Mags describes the present sequence as:
Bottom, recovery, neckline rejection or possible fakeout, then potentially another attempt higher.
That does not mean Bitcoin will copy the previous cycle exactly.
Fractals rarely do.
The comparison is useful because it gives traders a framework for identifying which levels could determine whether the similarity remains valid.
Read also: UFC Star Says He Is a Proud “Hard” Bitcoin Holder
The Neckline Is the Key Level
The most important area on Mags’ chart sits around the low-to-mid $80,000 region.
Bitcoin is currently trading close to $83,000 on the chart and remains underneath both the neckline and the descending trendline.
That creates a clear technical test.
If BTC can push above these levels and hold them as support, the current structure would begin to look much more like the recovery that followed the 2022 bottom.
The chart then leaves room for another move toward the $90,000 area and potentially higher.
Failure at the same zone would keep Bitcoin trapped underneath resistance and increase the chance of another move lower.
$74K Could Still Fit the Bullish Structure
Mags also identifies roughly $74,000 as an important support zone.
This is a crucial part of his thesis because another move lower would not automatically destroy the bullish fractal.
His chart shows Bitcoin potentially falling back toward $74,000, holding that area, and then attempting another recovery.
That would resemble the previous cycle, where Bitcoin also experienced a notable rejection before eventually moving through the neckline.
The critical condition would be holding the broader support structure.
A decisive loss of the $74,000 region would make the comparison considerably weaker.
Read also: Crypto Crash Warning: How Low Can Bitcoin and Ethereum Prices Go?
Bitcoin Price Outlook
The chart leaves Bitcoin with two important levels.
The first is the neckline around the $83,000 to $87,000 region.
A sustained move above that area and the falling trendline would strengthen the case that Bitcoin is following the previous cycle’s recovery structure.
The second is support near $74,000.
A rejection from current levels followed by a move toward $74,000 could still fit Mags’ bullish fractal, provided buyers defend that zone.
The main risk is assuming the historical comparison guarantees the same result.
Market conditions, liquidity and timing are different in every cycle.
Still, Mags’ chart provides a useful roadmap.
For more crypto news and price predictions, click here.
Subscribe to our YouTube channel for daily crypto updates, market insights, and expert analysis.