Cardano price has risen for a 3rd consecutive day, and trader Lucky believes ADA could be preparing for a much faster advance. His chart connects the recent recovery to a larger technical pattern, although resistance levels could still interrupt the move.
ADA is trading around $0.27 in our analysis, close to an area that could determine its next direction. Lucky’s bullish outlook and our ascending channel analysis provide different perspectives on the same recovery. The important question is whether Cardano can turn its recent progress into a sustained breakout.
What you'll learn 👉
Lucky’s Cardano Price Prediction Centers On A Falling Wedge Breakout
Lucky, known as @LLuciano_BTC on X, wrote that ADA was “setting its tone for another parabolic run.” A parabolic run describes a rally that accelerates as price rises, rather than a steady advance at a similar pace.
His attached daily Cardano chart shows a broad falling wedge. The upper blue trendline slopes downward across the declining highs, and the lower boundary descends more gradually beneath the price lows. Those boundaries move closer together as the pattern develops.
A look at the ADA chart shows price moving above the upper trendline near the area Lucky labels “Breakout.” The circled section marks the transition from trading beneath that boundary to trading above it.
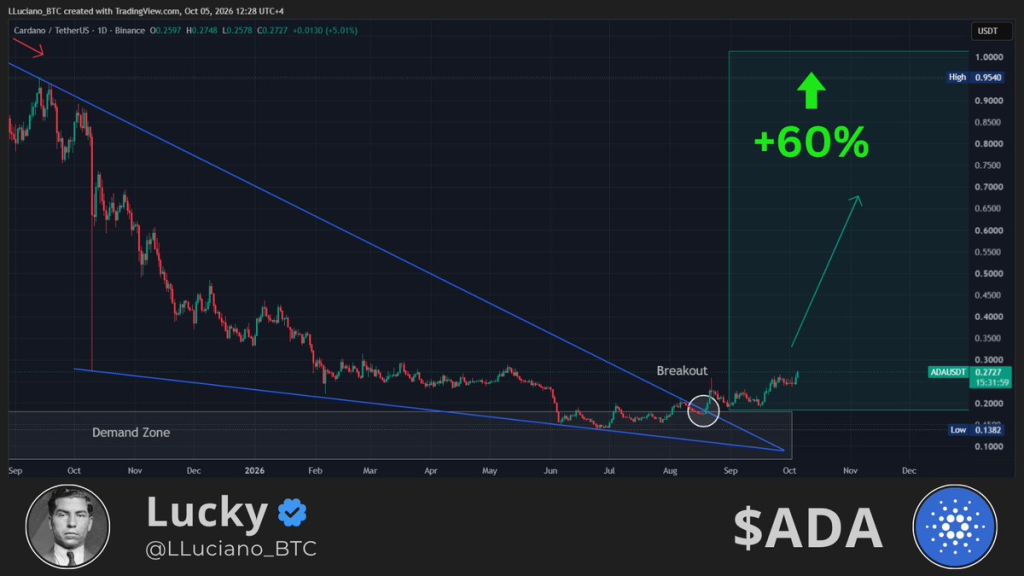
That matters because the upper trendline had contained the broader decline. A move above it can indicate that the previous pattern of lower highs is weakening. However, the breakout alone does not establish that a parabolic rally will follow.
Lucky’s ADA Chart Shows A Demand Zone And A 60% Projection
Lucky also marks a demand zone beneath the recent price action, close to the lower portion of the wedge. This is the area his chart identifies as a potential base for the recovery.
The latest displayed ADA price is approximately $0.2777. Price has moved above the marked zone, but the chart still places the recovery near the bottom of the much larger historical decline.
Several details help explain his bullish interpretation:
- ADA has crossed above the descending upper trendline.
- The marked demand zone lies beneath recent price action.
- A green annotation presents a projected 60% advance.
The percentage requires careful interpretation because the graphic also contains an upward arrow that extends much higher. A 60% increase from approximately $0.2777 would place ADA near $0.44. The arrow itself should not be treated as a precise price target because Lucky’s supplied statement does not explain its endpoint.
His chart therefore presents a bullish scenario, not confirmation that every marked price area will be reached.
Our Cardano Price Analysis Shows An Ascending Channel Near Resistance
Our analysis examines a more recent structure. Cardano price has traded inside an ascending channel since June, and the latest recovery has brought ADA close to its upper boundary again.
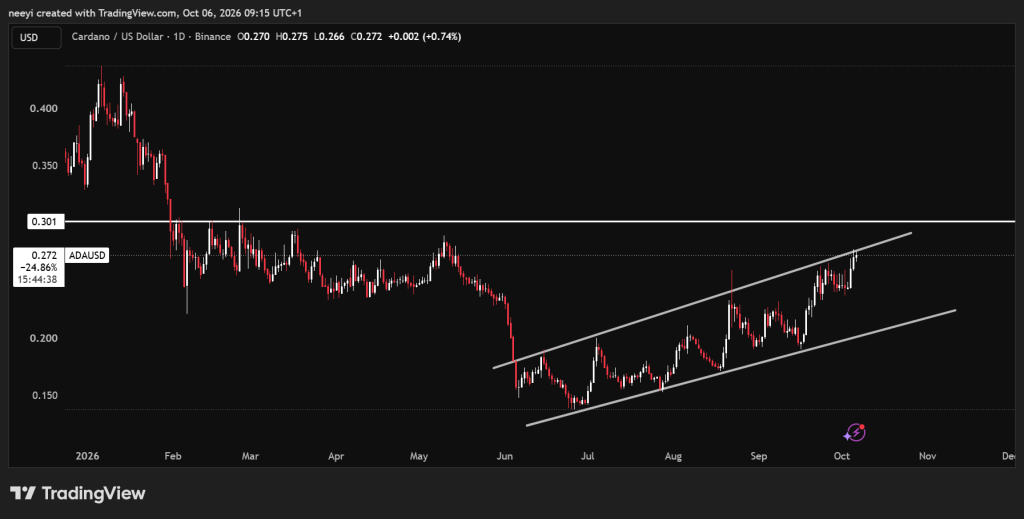
An ascending channel contains rising support and resistance lines. Price can continue to recover within that structure without breaking above the upper boundary.
That distinction matters after 3 consecutive days of higher prices. The recovery remains constructive, but its location near channel resistance creates room for a pullback.
A rejection from the current area could send ADA toward approximately $0.258. A break below that level would put $0.23 next in focus. Losing $0.23 could then open a move toward the channel’s lower boundary near $0.21.
These levels describe a conditional downside sequence. Cardano would need to lose each support area before the next becomes the main concern.
Cardano Price Needs To Clear $0.30 Before A Larger Recovery
Continued bullish momentum could carry Cardano price toward $0.30 this week. That level has acted as resistance since the final day of January, so reaching it would create another test.
The main levels in our analysis are:
| ADA Price Level | Role In The Outlook |
|---|---|
| $0.258 | Initial support after a potential rejection. |
| $0.23 | Next support if $0.258 gives way. |
| $0.21 | Lower channel area if selling continues. |
| $0.30 | Major resistance above the current price. |
| $0.43 | January high that could return to focus after a breakout. |
A rejection at $0.30 could begin a decline even if ADA first moves above its current channel resistance. A sustained break above $0.30 would strengthen the case for a recovery toward January highs around $0.43 before the year ends.
Lucky’s falling wedge breakout offers a bullish explanation for the recovery, and our channel analysis identifies the nearer obstacles. Cardano now has a chance to test whether this advance can carry beyond familiar resistance.
FAQs
Subscribe to our YouTube channel for daily crypto updates, market insights, and expert analysis.