
Ethereum and Solana enter October 6 without a clear breakout, but Cardano has already moved above its recent consolidation. That difference gives today’s crypto price prediction an interesting starting point: can ADA extend its recovery, or will the broader market keep all 3 assets close to their current levels?
The chart readings show different strengths across these coins. Ethereum’s signals remain mixed, Solana faces some downside pressure, and Cardano has stronger bullish readings. Each setup still needs confirmation from price before a larger move becomes convincing.
What you'll learn 👉
Ethereum Price Remains Between $2,600 And $2,700 As Indicators Stay Mixed
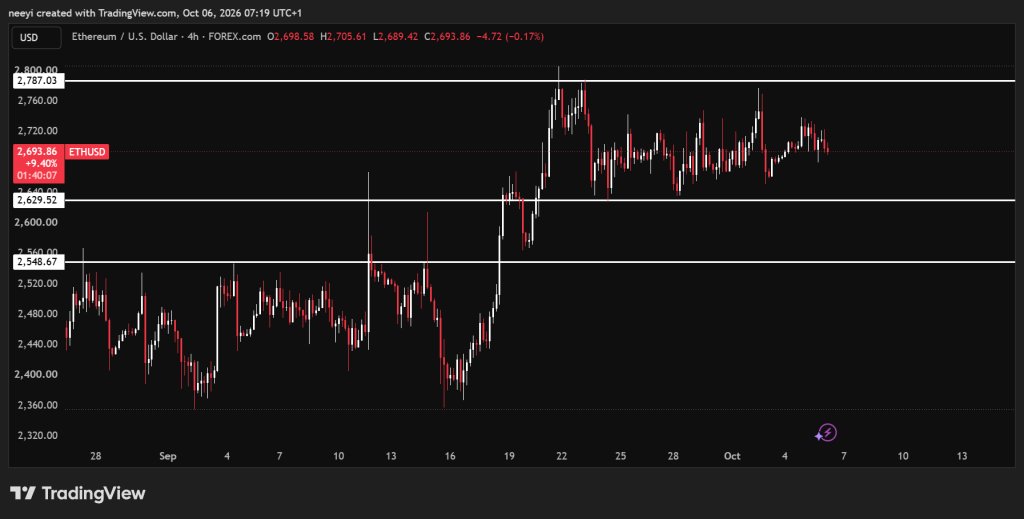
Ethereum price continues to trade between $2,600 and $2,700 without a clear direction. Continued consolidation looks like the most likely outcome today unless stronger buying or selling pressure pushes ETH outside that range.
A look at the Ethereum chart shows $2,600 as the immediate support and $2,700 as resistance. A sustained move below support could open a path toward $2,500. A confirmed breakout above resistance could put $2,900 within reach, although that would require stronger bullish momentum.
The supplied readings from the Investing.com 5-hour chart explain why the Ethereum price outlook remains balanced.
The RSI at 50.274 is close to its midpoint. This means recent price momentum gives neither buyers nor sellers a clear advantage.
The Stochastic at 46.341 also carries a neutral reading. ETH has room to move in either direction, but this indicator offers little confirmation of a breakout.
The MACD at 4.39 carries a buy signal. It provides some support for the bullish case, although Ethereum price still needs to clear resistance.
The Ultimate Oscillator at 45.871 carries a sell signal. That weaker reading reduces confidence in an immediate rally and supports the possibility of continued consolidation.
| Indicator | Value | Signal |
|---|---|---|
| RSI (14) | 50.274 | Neutral |
| Stochastic (9,6) | 46.341 | Neutral |
| MACD (12,26) | 4.39 | Buy |
| Ultimate Oscillator | 45.871 | Sell |
Ethereum Price Prediction For Today
- Bullish Scenario: ETH holds above $2,700 after a breakout, which could open the way toward $2,900.
- Neutral Scenario: Ethereum continues to trade between $2,600 and $2,700 as mixed momentum prevents a decisive move.
- Bearish Scenario: ETH loses $2,600 support, which could bring $2,500 into play today.
Solana Price Holds Its Range Despite Weaker Momentum Readings
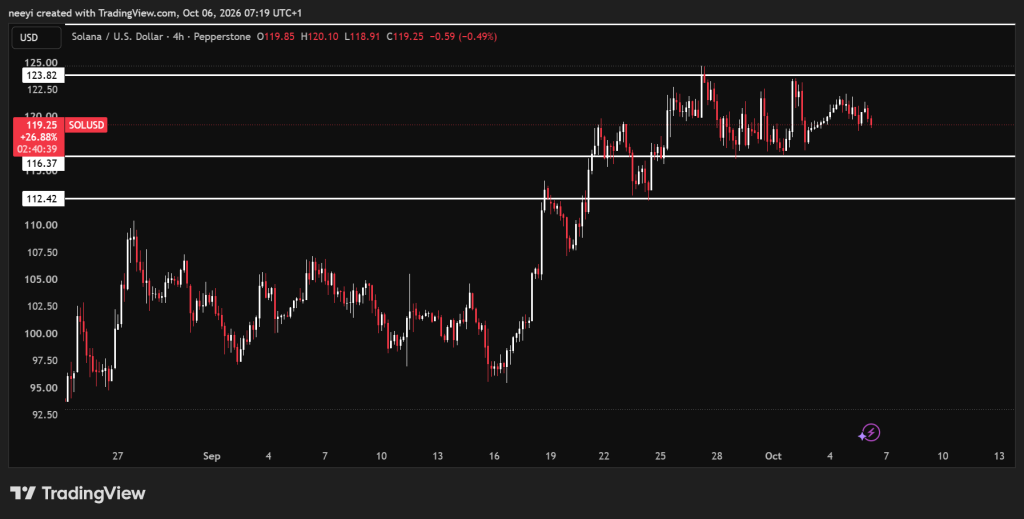
Solana price remains between $116 and $123. This range defines the immediate outlook, although its indicator readings show more weakness than Ethereum’s.
A break below $116 could take SOL toward $112. A sustained move above $123 could open the way toward $128 and potentially $130 before the day ends.
The supplied Investing.com 5-hour chart readings show why confirmation matters here.
The RSI at 49.061 remains neutral, but its position slightly below 50 gives sellers a small momentum advantage.
The Stochastic at 39.806 carries a sell signal. It points to weaker recent price momentum and increases the risk of another support test.
The MACD at 0.093 carries a buy signal. This offers some bullish support, although the positive reading alone cannot confirm a move above $123.
The Ultimate Oscillator at 36.169 carries a sell signal. It reinforces the weaker momentum picture and makes an immediate rally less convincing.
| Indicator | Value | Signal |
|---|---|---|
| RSI (14) | 49.061 | Neutral |
| Stochastic (9,6) | 39.806 | Sell |
| MACD (12,26) | 0.093 | Buy |
| Ultimate Oscillator | 36.169 | Sell |
Solana Price Prediction For Today
- Bullish Scenario: SOL breaks above $123 and holds that level, with $128 to $130 as possible targets.
- Neutral Scenario: Solana continues to consolidate between $116 and $123 without a confirmed breakout.
- Bearish Scenario: SOL falls below $116, which could expose the next downside level around $112.
Cardano Price Tests Its Breakout After Monday’s Recovery
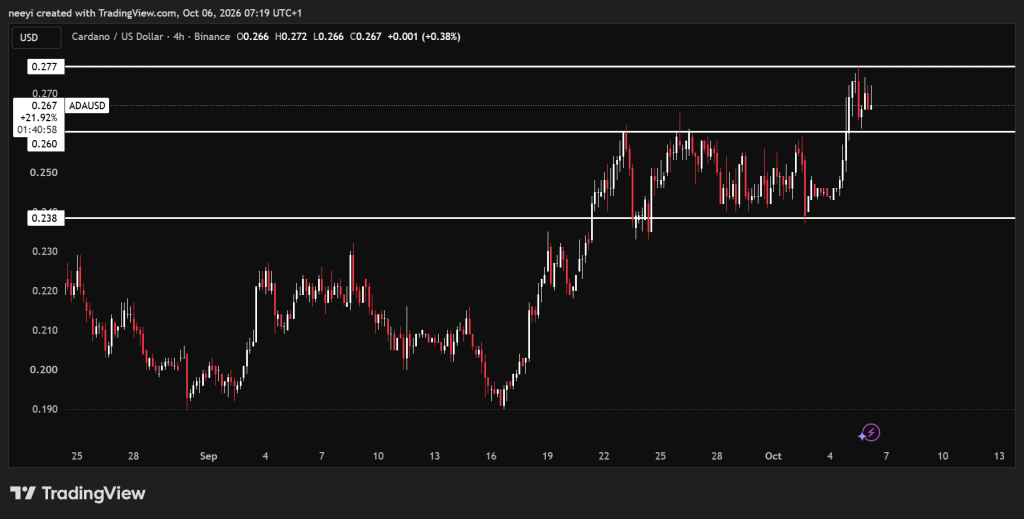
Cardano price broke above its consolidation on Monday and reached approximately $0.277. ADA has since pulled back toward $0.269, so the immediate question is whether that breakout can hold.
The supplied Investing.com 5-hour chart readings favour buyers.
The RSI at 62.556 carries a buy signal and shows stronger bullish momentum without reaching the usual overbought threshold of 70.
The Stochastic at 78.58 also carries a buy signal. However, its proximity to 80 means the recent advance could face a pause.
The MACD at 0.005 carries a buy signal and supports the recovery. Continued price strength would help confirm that signal.
The Ultimate Oscillator at 56.948 carries a buy signal. Its position above 50 adds support to the bullish outlook.
| Indicator | Value | Signal |
|---|---|---|
| RSI (14) | 62.556 | Buy |
| Stochastic (9,6) | 78.58 | Buy |
| MACD (12,26) | 0.005 | Buy |
| Ultimate Oscillator | 56.948 | Buy |
Cardano Price Prediction For Today
- Bullish Scenario: ADA reclaims $0.27 and clears the recent $0.277 high, which could open a path toward $0.29.
- Neutral Scenario: Cardano consolidates near $0.269 as buyers attempt to preserve Monday’s breakout.
- Bearish Scenario: ADA loses $0.26 and retreats toward $0.23. A further decline toward $0.22 would require stronger selling pressure and remains the least likely supplied scenario.
Cardano currently has the strongest indicator readings, but Ethereum and Solana still need to escape their ranges.
FAQs
Subscribe to our YouTube channel for daily crypto updates, market insights, and expert analysis.