Silver could eventually leave today’s price levels behind, if Hemant Pandey’s latest prediction plays out. The analyst expects a much higher valuation over time, but the current silver price outlook presents an immediate challenge. A familiar chart level is standing between the latest recovery and a stronger move higher.
That creates an interesting contrast between Pandey’s confidence and silver’s recent performance. His forecast looks beyond the current pullback, but the chart and technical indicators help explain what needs to happen before that bullish outlook starts looking more convincing.
What you'll learn 👉
Hemant Pandey Predicts Silver Price Could Reach $70, $100 And $300
Hemant Pandey, who posts through the X account @ajayhemant, expects silver to reach $70, $100 and eventually $300. His commentary also makes a specific claim about the opportunity to buy silver around $63.
Pandey believes this price will no longer be available after 2026. He compares it with earlier levels around $15, $30 and $50, which he considers prices that silver has already left behind.
His silver price prediction contains several points:
- $70 is his first named target: Reaching this level would take silver above the nearby resistance and the $63 area discussed in his commentary.
- $100 represents a larger advance: This target would require silver to extend its recovery well beyond the current trading range.
- $300 is his most ambitious target: Pandey expects this price eventually, although he does not provide a specific date.
- $63 carries his clearest timing claim: He argues that the opportunity to buy around this level will disappear after 2026.
The reference to 2026 concerns the availability of $63 silver. It does not establish a deadline for all his higher targets.
His argument depends on silver maintaining a higher price range after its next advance. The current chart provides a more immediate test because silver has lost a level that previously supported its price.
#Silver $70 will come, $100 will come, $300 will also come in due time. But this time to buy at $63 will never come back again after 2026. Same way $15,$30,$50 ain't coming back.
— Hemant Pandey (@ajayhemant) September 24, 2026
Doubters will keep doubting.
People don't realise stackers have bought at $15.
Silver Price Tests $62 After Losing A Familiar Support Level
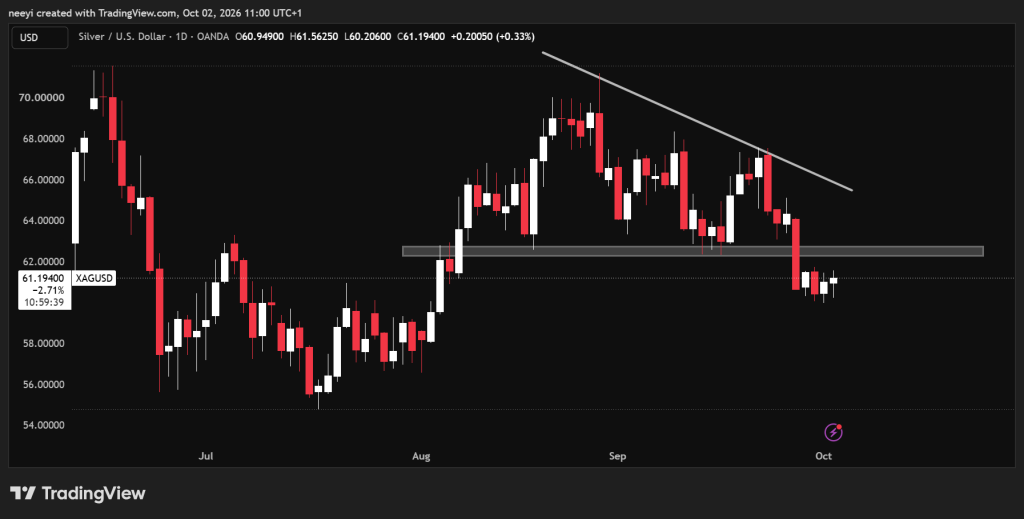
A look at the silver chart shows that $62 has played an important role across several months. The level initially limited silver’s advance before becoming support after a breakout.
The sequence explains why the latest test matters:
- June to early August: Silver traded below $62, and the area acted as resistance against further price advances.
- August through much of September: Silver broke above $62, and the former resistance became support beneath the price.
- September 28: Silver fell below $62, which ended the period when this area had supported the price.
- The latest recovery from around $61: Silver has returned toward $62 and is testing the former support as resistance.
This change puts silver in a more difficult position. Buyers previously defended $62 from above, but the price now needs enough demand to break through it from below.
The recovery from around $61 shows that silver has moved back toward the level. However, returning to former support does not mean the price has recovered it. The stronger development would be a breakout above $62 followed by price activity that holds above the area.
Silver Price Outlook Keeps $59, $56 And $54 In Focus
The next few weeks could depend on whether $62 continues to block silver’s recovery. A rejection would leave the bearish chart setup intact and increase the possibility of another move lower.
The main scenarios are straightforward:
- Silver remains below $62: Continued rejection could bring $59 into focus, followed by $56 and potentially $54 if selling pressure persists.
- Silver breaks above $62: A sustained recovery could weaken the bearish setup and create room for a further advance.
These potential downside levels would become relevant progressively. Silver would first need to move toward $59 before the lower areas become more immediate concerns.
The bullish scenario requires stronger buying pressure than the recent bounce has demonstrated. Silver needs to overcome $62 and then defend it again as support. The supplied indicators help explain why that recovery still faces resistance.
RSI Shows Silver Momentum Remains Below Neutral
Silver’s RSI reading of 41.333 is below the neutral 50 level. This points to weaker momentum and supports the view that buyers have not regained control.
The reading remains above the commonly used oversold threshold of 30. That means the RSI does not currently identify an extreme oversold condition. A move above 50 would provide stronger evidence of improving bullish momentum.
Stochastic Places Silver Close To Oversold Territory
The Stochastic reading of 21.577 is near the commonly used oversold boundary of 20. This indicates that silver has recently traded close to the lower end of its measured price range.
Such conditions can accompany a rebound, but a low reading alone does not confirm a reversal. Silver’s ability to recover $62 would provide a clearer price confirmation that the rebound has strength.
MACD Supports The Bearish Silver Price Outlook
The MACD reading of negative 0.746 points to weak momentum. A negative MACD generally means the shorter moving average remains below the longer moving average used in its calculation.
This fits silver’s difficulty below resistance. The supplied value does not establish whether a fresh crossover has occurred, but movement toward zero would indicate that the negative momentum is easing.
Read Also: Why Kaspa’s Toccata Upgrade Could Be A Bigger Deal Than It Looks
Ultimate Oscillator Shows Modest Weakness Across Its Measured Periods
The Ultimate Oscillator reading of 47.104 is slightly below its midpoint of 50. It indicates modest weakness across the periods included in the calculation.
The reading is not deeply oversold, which means it offers limited evidence that selling pressure has reached an extreme. A stronger reading alongside a breakout above $62 would make the recovery more convincing.
Bull/Bear Power Indicates Bearish Pressure Remains Stronger
The Bull/Bear Power reading of negative 4.108 supports the bearish assessment. The negative value indicates pressure below the indicator’s moving average baseline.
This is consistent with silver’s struggle to reclaim former support. Movement toward zero would indicate easing bearish pressure, but the price would still need to confirm improvement above $62.
| Indicator | Value | Action |
|---|---|---|
| RSI (14) | 41.333 | Momentum remains weak below the neutral 50 level. |
| Stochastic (9,6) | 21.577 | Near oversold territory, but recovery needs price confirmation. |
| MACD (12,26) | −0.746 | Negative momentum continues to limit the bullish recovery. |
| Ultimate Oscillator | 47.104 | Modest weakness provides limited support for a stronger rebound. |
| Bull/Bear Power (13) | −4.108 | Bearish pressure remains stronger around the resistance test. |
FAQs
Subscribe to our YouTube channel for daily crypto updates, market insights, and expert analysis.