
The Kaspa price is entering October after a month that changed the technical picture. KAS climbed more than 50% across September, but the rally has cooled, with the KAS price down 2.37% over the past 24 hours to $0.0422.
The decline comes as the broader crypto market trades slightly lower, with no fresh Kaspa-specific catalyst driving the move. Profit-taking and softer trading interest have instead taken over after September’s advance.
That leaves October with a clear test: can buyers defend the support created during the recovery, or will fading network activity and weaker whale accumulation pressure KAS lower? The answer will depend on the $0.038 liquidity zone, overhead resistance, and whether buyers can regain control after September’s powerful recovery this month.
What you'll learn 👉
News Pushing Kaspa Price Presently
Kaspa logged a roughly 12% daily gain despite a sharp decline in daily active users and transaction activity. The KAS price was around $0.0432 at the time, giving the token a market capitalization near $1.2 billion.
The divergence matters because the price advance has not been matched by stronger network usage, leaving traders with a key question over how much of the move is being driven by market sentiment.
New derivatives access may be part of the explanation. PrimeXBT added KAS to its crypto futures lineup on September 29, giving traders access to USDT-paired KAS futures with leverage of up to 1:100. That gives Kaspa (KAS) another derivatives market and could increase trading liquidity, but the high leverage can also amplify price volatility.
Whale activity provides another data point. BSC News reported that the largest known Kaspa whale wallet accumulated about 24 million KAS in September but withdrew 17 million, leaving a net inflow of only 7 million KAS.
That compares with roughly 56 million in June, 32 million in July, and 20 million in August. The wallet had already withdrawn another 4.52 million KAS in October, showing that large-holder accumulation has weakened.
What Is the Kaspa Chart Showing?
We had a look at the chart, and September delivered a strong recovery from roughly $0.027 to almost $0.050. After reaching that area around September 27, the KAS price began making lower highs and has fallen toward $0.0422. The first nearby support is around $0.040, with the more important liquidity zone near $0.038.
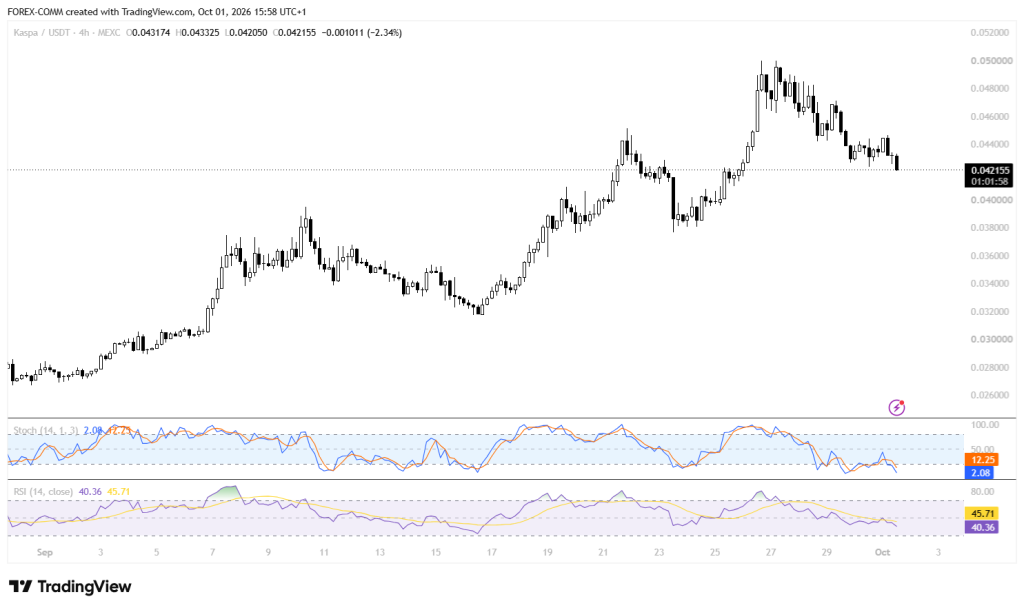
Momentum indicators also show that the recovery has cooled. The Stochastic oscillator is at 2.08, with its signal line around 12.25, placing the indicator deep inside oversold territory. The RSI is at 40.36, below its 45.71 moving average and under the neutral 50 level. That combination leaves room for a technical bounce, but buyers still need to reclaim higher resistance levels.
On the upside, $0.044-$0.046 is the first resistance region based on the recent candles. Above that, the September peak near $0.050 becomes the major test. A clean move through $0.050 would put the next possible extension around $0.055-$0.058.
Related Kaspa News: Kaspa Price Prediction: Here’s Where KAS Could Go This Week
Where Will Kaspa Price Go in October?
The first path is bullish. If the KAS price holds $0.040-$0.038 and breaks through $0.046, buyers could retest $0.050. A confirmed move above September’s $0.050 peak would open room toward $0.055-$0.058, based on an extension of the September recovery range.
The base path is consolidation between $0.038 and $0.046. This would keep the September recovery intact without immediately producing a new high.
The oversold Stochastic reading could support a bounce toward $0.044-$0.046, but weak network activity and reduced whale accumulation could limit upside.
The bearish path begins if the Kaspa price loses $0.038. The next areas to watch would be around $0.034 and $0.032, both near previous September trading zones. A break below $0.032 would put the earlier $0.027 September low back into view.
Frequently Asked Questions
Subscribe to our YouTube channel for daily crypto updates, market insights, and expert analysis.