
Kaspa is closing in on $0.050 after the KAS price jumped 10.12% in 24 hours to $0.0487, fueled by fresh real-estate adoption news and stronger demand across the altcoin market.
The move has put KAS well ahead of Bitcoin’s 1.11% gain, with Bayit Development’s plan to accept Kaspa payments for two luxury townhomes in Miami providing a clear catalyst.
Also, the CMC Altcoin Season Index has climbed 29.17% over the past week to 62, showing stronger activity across altcoins.
Technically, the KAS price has broken above its 7-day and 30-day moving averages at $0.0419 and $0.0360. With the 14-day RSI at 73.1, the KAS price has strong upside momentum, but buyers now face an important test near $0.050.
What you'll learn 👉
News Pushing Kaspa Price Presently
The biggest catalyst behind the KAS price move is the announcement from Bayit Development that it plans to accept Kaspa payments for two luxury townhomes in Miami. The properties are expected to be completed in March 2027, and the announcement was made on September 26.
The development gives Kaspa a concrete use case in a high-value real estate transaction, creating a fundamental reason behind the latest buying activity. Trading volume also rose 111.51% to $48.97 million, showing that the move came with a major increase in market participation.
The broader altcoin market has also provided support for the Kaspa price. The CMC Altcoin Season Index rose 29.17% over the past week to 62, indicating stronger altcoin participation. Kaspa has also moved above its 7-day moving average of $0.0419 and its 30-day moving average of $0.0360. These levels are now important reference points if buyers attempt to hold the latest breakout.
There is also a notable change in whale activity. Kaspa Daily reported that the 30-day net change in balances held by wallets containing more than 10 million KAS remains negative at -6.14 million KAS, but that figure is far better than the 30-day average of -98.08 million KAS.
Whales are still distributing KAS over the 30-day period, but the pace has slowed considerably as the KAS price has moved higher. That reduces one source of selling pressure, although the data does not yet show outright whale accumulation.
Here’s What the Kaspa Price Chart Is Showing
We had a look at the chart, and the technical structure has improved considerably since the token found support around $0.032 in the middle of the month. KAS then climbed through $0.038, moved above $0.040 and reclaimed the major horizontal level around $0.041. After briefly consolidating around $0.038-$0.040, the price broke higher and reached almost $0.050.
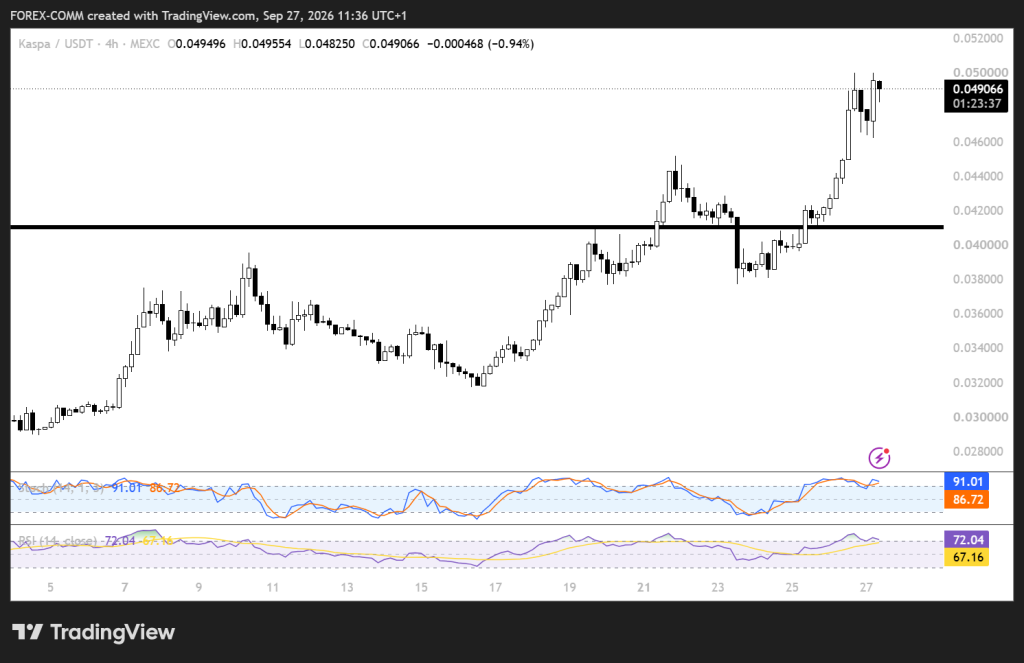
The latest candles show the Kaspa price trading around $0.0491, close to the psychological $0.050 resistance. The recent high is just below $0.050, making that level the first major barrier for buyers. A clean move above $0.050 could open the door toward $0.052 and potentially $0.055 if volume remains elevated.
Momentum indicators also show that the rally is strong. The chart’s Stochastic readings are 91.01 and 86.72, placing the indicator deep in overbought territory. The RSI stands at 72.04, with its moving average at 67.16. These readings support the strength of the KAS price move, but they also leave room for consolidation if buyers take profits near $0.050.
The key support remains around $0.041, marked by the major horizontal level on the chart. Above that, the $0.046-$0.047 area could provide an initial cushion if KAS retreats from $0.050. A break below $0.041 would weaken the bullish setup and bring the $0.038 area into focus.
Related Kaspa News: The Kaspa Story Most KAS Holders Probably Don’t Know
Where Will Kaspa Price Go This Week?
Bullish path:
$0.052-0.055. If the KAS price breaks above $0.050 with strong volume, the next technical targets are around $0.052 and $0.055. The 111.51% increase in trading volume, the real estate adoption news and easing whale distribution would give buyers several data points to support another move higher.
Base path:
$0.046-0.052. KAS could consolidate after reaching the $0.050 area, especially with RSI at 72.04 and Stochastic above 86. A move back toward $0.046-$0.047 followed by another test of $0.050 would keep the broader breakout structure intact.
Bearish path:
$0.038-$0.044. If $0.050 rejects strongly and selling increases, the KAS price could retreat toward $0.044 and then the $0.041 support. Losing $0.041 would expose the $0.038 region, making the breakout above the key horizontal level less convincing.
Frequently Asked Questions
Subscribe to our YouTube channel for daily crypto updates, market insights, and expert analysis.